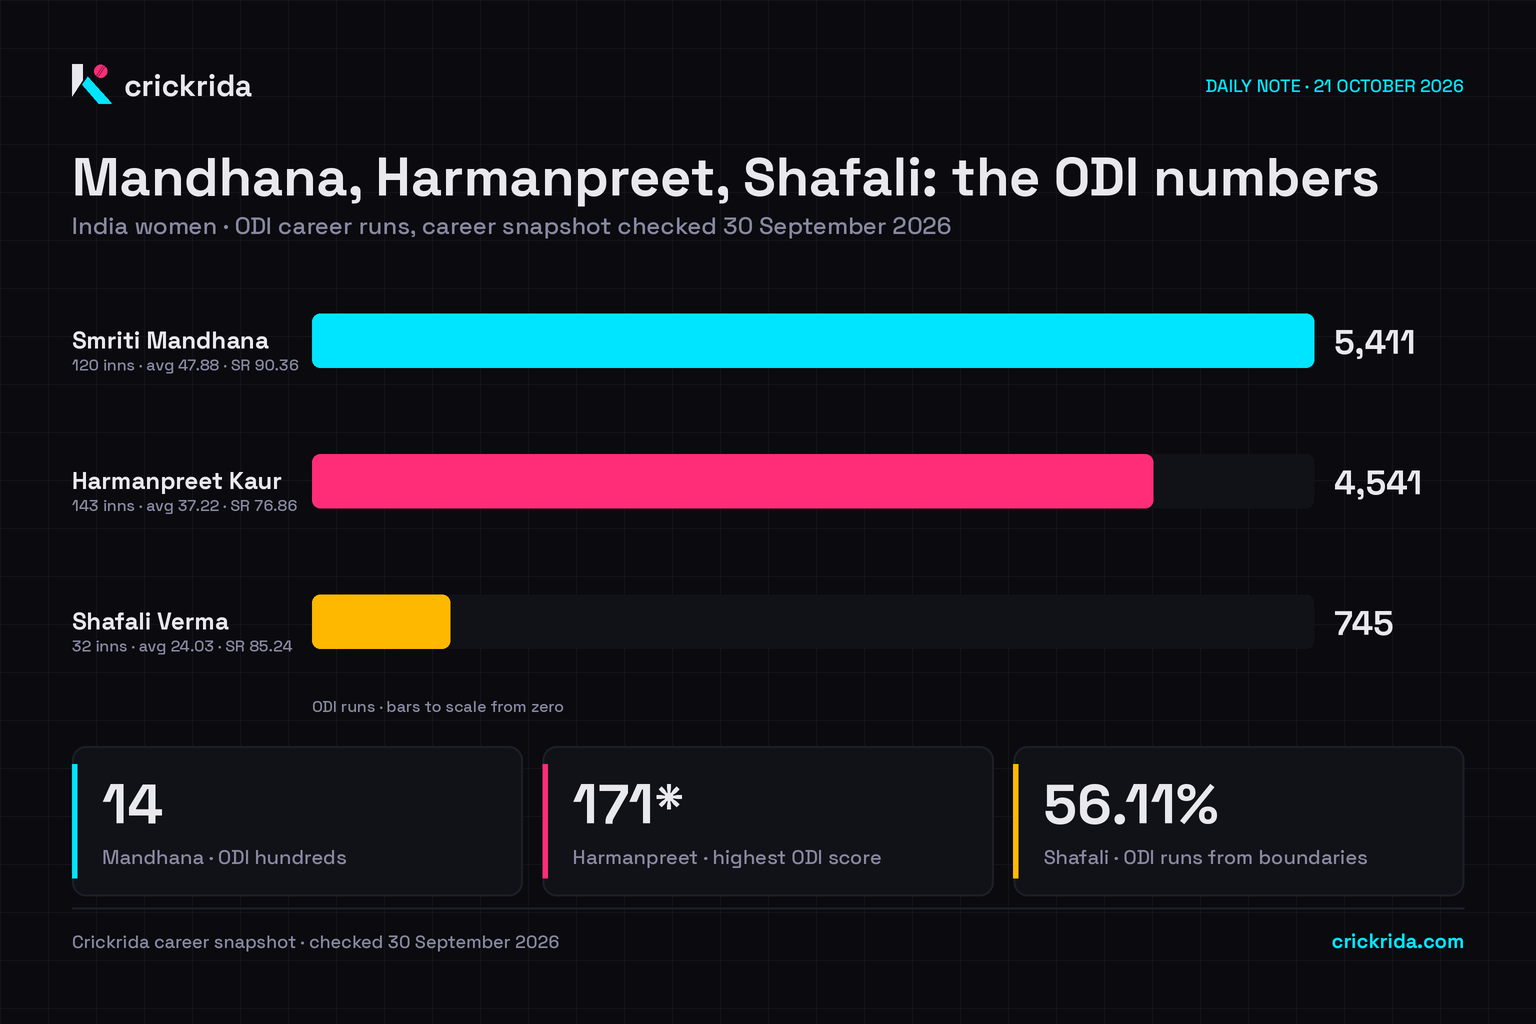
India's women switch to 50 overs against Zimbabwe after sweeping the T20Is 3-0. Three batters carry most of the ODI evidence: Smriti Mandhana with 5,411 runs, Harmanpreet Kaur with 4,541 and Shafali Verma with 745. Here is what those totals say, and what they leave out.
Mandhana: volume and rate together
Smriti Mandhana has 5,411 ODI runs from 120 innings, an average of 47.88 and a strike rate of 90.36. She leads this trio on both, so her run total is not just a product of more innings. Her 14 hundreds and 35 fifties make 49 scores of 50 or more: one in every 2.4 innings.
Harmanpreet: the longest ODI record
Harmanpreet Kaur has played the most ODIs here, 164, with 4,541 runs from 143 innings at 37.22. Her 21 not-outs are the most of the three, which lifts her average without adding dismissals. Her highest score, 171 not out, is the biggest individual ODI innings among them. Compare Mandhana and Harmanpreet format by format.
Shafali: a T20I record, a shorter ODI one
Shafali Verma has 3,325 T20I runs at a strike rate of 141.00 but only 32 ODI innings: 745 runs at 24.03, striking at 85.24. Boundaries supply 56.11% of those ODI runs (91 fours, 9 sixes), compared with 56.48% for Mandhana and 46.99% for Harmanpreet. She has five ODI fifties and no hundred yet. With 32 innings, her ODI numbers can still move quickly.
What the snapshot can and cannot tell you
These are career totals at one snapshot, not form. The most recent India women's ODI scorecard in our archive is the 1 March 2026 match against Australia, so the T20I series does not change these ODI figures. Find the leaders in women's ODI most runs and most centuries.
Read the previous women's note
Shafali and Mandhana's 130-run opening stand is covered in Women's Asia Cup 2026 final: the numbers behind India's title.
The figures behind the infographic
| Statistic | Smriti Mandhana | Harmanpreet Kaur | Shafali Verma |
|---|---|---|---|
| ODIs | 120 | 164 | 32 |
| Batting innings | 120 | 143 | 32 |
| Runs | 5,411 | 4,541 | 745 |
| Balls faced | 5,988 | 5,908 | 874 |
| Not-outs | 7 | 21 | 1 |
| Batting average | 47.88 | 37.22 | 24.03 |
| Strike rate | 90.36 | 76.86 | 85.24 |
| 100s | 14 | 7 | 0 |
| 50s (50–99) | 35 | 24 | 5 |
| Highest score | 136 | 171* | 87 |
| Runs from boundaries | 56.48% | 46.99% | 56.11% |
Compare two international careers · Smriti Mandhana profile · Harmanpreet Kaur profile · Shafali Verma profile · Create your own visual
Figures frozen from Crickrida's official career snapshot checked 30 September 2026. Batting average = runs ÷ dismissals; strike rate = 100 × runs ÷ balls faced, both shown to two decimals using the source's truncation convention. Boundary share = (4 × fours + 6 × sixes) ÷ runs. Fifties count scores from 50 to 99. An asterisk denotes not out.