Home / Players / Sikandar Raza Overview Test22 ODI162 T20I147 IPL9 T20 World Cup20 Recent scores Oldest on the left. Recorded scorecards only. The top edge marks the result for their side.
Last 12 batting innings 518 Runs
51.80 Average
100.19 Strike rate
1 Hundreds
Last 12 bowling innings 11 Wickets
2/28 Best
6.39 Economy
Career records by format Batting career records by format Format Mat Inns NO Runs HS Avg BF SR 100s 50s 0s 4s 6s Test 22 42 0 1,434 127 34.14 2,555 56.12 1 11 3 146 17 ODI 162 153 24 4,824 141 37.39 5,641 85.51 7 27 3 400 112 T20I 147 142 13 3,369 133* 26.11 2,468 136.50 2 17 12 258 161
Bowling career records by format Format Mat Inns Balls Mdns Runs Wkts BBI BBM Avg Econ SR 4w 5w 10w Test 22 31 3,335 68 1,782 40 7/113 8/176 44.55 3.20 83.37 0 2 0 ODI 162 130 5,468 26 4,445 101 4/55 4/55 44.00 4.87 54.13 1 0 - T20I 147 132 2,496 5 2,948 116 5/18 5/18 25.41 7.08 21.51 2 1 -
Fielding career records by format Format Mat Inns Ct St Dis Dis/inns Best Test 22 38 7 0 7 0.184 1 (1ct 0st) ODI 162 158 64 0 64 0.405 3 (3ct 0st) T20I 147 145 66 0 66 0.455 3 (3ct 0st)
Runs by format
1,434 15% 4,824 50% 3,369 35%
Wickets by format
40 16% 101 39% 116 45%
Career records checked 2026-11-09. Independent of the scorecard archive.
IPL and T20 World Cup IPL and T20 World Cup records Competition Span Mat Runs Avg SR Wkts Econ BBI IPL 2023 to 2024 9 182 26.00 133.82 3 10.07 1/19 T20 World Cup 2014 to 2026 20 484 26.88 143.62 18 7.45 3/19
From ball-by-ball data. T20 World Cup matches are also part of the T20I record above.
Zimbabwe · Compare with another player
Innings explorer 331 scorecards Open explorer
Scorecard coverage Scorecard coverage of the official career Format Official bat inns In scorecards Official bowl inns In scorecards First Latest Coverage Test 42 42 31 31 2013-09-03 2025-10-20 Complete ODI 153 153 130 130 2013-05-03 2026-10-23 Complete T20I 142 142 132 132 2013-05-11 2026-11-01 Complete
1,434 Runs
34.14 Bat avg
56.12 Strike rate
40 Wickets
44.55 Bowl avg
3.20 Economy
Recent scores Oldest on the left. Recorded scorecards only. The top edge marks the result for their side.
Last 12 batting innings 397 Runs
33.08 Average
62.71 Strike rate
Last 12 bowling innings 17 Wickets
7/113 Best
2.85 Economy
Official Test record Official Test batting record Batting Mat Inns NO Runs HS Avg BF SR 100 50 0 4s 6s Career 22 42 0 1,434 127 34.14 2,555 56.12 1 11 3 146 17
Official Test bowling record Bowling Mat Inns Balls Mdns Runs Wkts BBI BBM Avg Econ SR 4w 5w 10w Career 22 31 3,335 68 1,782 40 7/113 8/176 44.55 3.20 83.37 0 2 0
Official Test fielding record Fielding Mat Inns Ct St Dis Dis/Inns Best Career 22 38 7 0 7 0.184 1 (1ct 0st)
Test career in charts Test batting form: average over 10 innings 20 40 60 Overall 34.1 Best spell: 43.0 up to 2017-10-29 Best 43.0 Latest: 26.9 2016 2017 2018 2020 2021 2025 Test runs by year 0 100 200 300 2013: 84 runs 84 2013 2014: 243 runs 243 2015: 0 runs 2015 2016: 62 runs 62 2017: 373 runs 373 2017 2018: 56 runs 56 2019: 0 runs 2019 2020: 219 runs 219 2021: 150 runs 150 2021 2022: 0 runs 2023: 0 runs 2023 2024: 0 runs 2025: 247 runs 247 2025 Last 20 Test innings
0 1-49 50-99 100+ * not out
Test innings by score How Test innings ended Caught 29 · 69.0%
Bowled 6 · 14.3%
LBW 4 · 9.5%
Stumped 2 · 4.8%
Caught and bowled 1 · 2.4%
Test batting position: average and innings Test runs from boundaries Fours 584 · 40.7%
Sixes 102 · 7.1%
Other runs 748 · 52.2%
Test bowling form: wickets per innings over 10 innings 1 2 Overall 1.29 Best spell: 2.40 up to 2020-01-27 Best 2.40 Latest: 0.90 2017 2018 2020 2021 2025 Test wickets by year 0 3 6 9 12 2014: 5 wickets 5 2014 2015: 0 wickets 2016: 1 wicket 1 2016 2017: 7 wickets 7 2018: 7 wickets 7 2018 2019: 0 wickets 2020: 12 wickets 12 2020 2021: 2 wickets 2 2022: 0 wickets 2022 2023: 0 wickets 2024: 0 wickets 2024 2025: 6 wickets 6 2025 Last 20 Test bowling innings
Test innings by wickets
Test record by situation complete career Opposition Home and away Match innings Batting position Match result Year Ground Series and tournaments
Sikandar Raza: Test batting by opposition Mat Inns NO Runs HS Avg BF SR 100 50 0 4s 6s Bangladesh 6 12 0 354 82 29.50 639 55.39 0 3 1 42 6 New Zealand 4 8 0 78 37 9.75 159 49.05 0 0 1 14 0 Afghanistan 4 6 0 314 85 52.33 505 62.17 0 3 0 27 4 Sri Lanka 3 6 0 327 127 54.50 545 60.00 1 1 0 26 4 West Indies 2 4 0 205 89 51.25 440 46.59 0 2 0 14 3 England 1 2 0 67 60 33.50 87 77.01 0 1 0 10 0 Pakistan 1 2 0 84 60 42.00 172 48.83 0 1 0 12 0 South Africa 1 2 0 5 5 2.50 8 62.50 0 0 1 1 0 All 22 42 0 1,434 127 34.14 2,555 56.12 1 11 3 146 17
Sikandar Raza: Test bowling by opposition Mat Inns Balls Mdns Runs Wkts BBI Avg Econ SR 4w 5w Bangladesh 6 11 1,020 10 640 13 3/35 49.23 3.76 78.46 0 0 Afghanistan 4 6 486 10 215 6 3/30 35.83 2.65 81.00 0 0 Sri Lanka 3 5 731 20 356 11 7/113 32.36 2.92 66.45 0 1 New Zealand 4 4 455 9 259 2 1/63 129.50 3.41 227.50 0 0 West Indies 2 3 468 17 194 7 5/99 27.71 2.48 66.85 0 1 England 1 1 144 1 93 1 1/93 93.00 3.87 144.00 0 0 South Africa 1 1 30 0 25 0 0/25 N/A 5.00 N/A 0 0 All 22 31 3,334 67 1,782 40 7/113 44.55 3.20 83.35 0 2
Sikandar Raza: Test batting by home and away Mat Inns NO Runs HS Avg BF SR 100 50 0 4s 6s Home 11 21 0 695 89 33.09 1,339 51.90 0 6 1 70 5 Away 9 18 0 589 127 32.72 986 59.73 1 4 2 64 8 Neutral 2 3 0 150 85 50.00 230 65.21 0 1 0 12 4 All 22 42 0 1,434 127 34.14 2,555 56.12 1 11 3 146 17
Sikandar Raza: Test bowling by home and away Mat Inns Balls Mdns Runs Wkts BBI Avg Econ SR 4w 5w Home 10 13 1,726 49 803 24 7/113 33.45 2.79 71.91 0 2 Away 9 15 1,380 14 876 14 3/35 62.57 3.80 98.57 0 0 Neutral 2 3 228 4 103 2 1/8 51.50 2.71 114.00 0 0 All 22 31 3,334 67 1,782 40 7/113 44.55 3.20 83.35 0 2
Sikandar Raza: Test batting by match innings Mat Inns NO Runs HS Avg BF SR 100 50 0 4s 6s 1st innings of the match 10 10 0 346 80 34.60 653 52.98 0 3 0 33 4 2nd innings of the match 12 12 0 423 85 35.25 718 58.91 0 5 2 46 1 3rd innings of the match 13 13 0 487 127 37.46 834 58.39 1 2 0 50 9 4th innings of the match 7 7 0 178 65 25.42 350 50.85 0 1 1 17 3 All 22 42 0 1,434 127 34.14 2,555 56.12 1 11 3 146 17
Sikandar Raza: Test bowling by match innings Mat Inns Balls Mdns Runs Wkts BBI Avg Econ SR 4w 5w 1st innings of the match 10 10 954 13 559 10 3/30 55.90 3.51 95.40 0 0 2nd innings of the match 10 10 1,450 34 734 22 7/113 33.36 3.03 65.90 0 2 3rd innings of the match 7 7 552 8 326 4 1/39 81.50 3.54 138.00 0 0 4th innings of the match 4 4 378 12 163 4 3/41 40.75 2.58 94.50 0 0 All 22 31 3,334 67 1,782 40 7/113 44.55 3.20 83.35 0 2
Sikandar Raza: Test batting by batting position Mat Inns NO Runs HS Avg BF SR 100 50 0 4s 6s No. 1 2 4 0 167 82 41.75 225 74.22 0 2 0 21 2 No. 2 1 1 0 51 51 51.00 122 41.80 0 1 0 6 0 No. 3 1 2 0 3 3 1.50 47 6.38 0 0 1 0 0 No. 4 3 5 0 208 61 41.60 391 53.19 0 2 0 23 2 No. 5 4 6 0 141 60 23.50 264 53.40 0 1 0 19 1 No. 6 14 22 0 859 127 39.04 1,480 58.04 1 5 1 76 12 No. 7 2 2 0 5 5 2.50 26 19.23 0 0 1 1 0 All 22 42 0 1,434 127 34.14 2,555 56.12 1 11 3 146 17
Sikandar Raza: Test batting by match result Mat Inns NO Runs HS Avg BF SR 100 50 0 4s 6s Won 3 4 0 152 65 38.00 232 65.51 0 1 0 17 1 Lost 17 34 0 1,007 127 29.61 1,800 55.94 1 7 3 109 12 Drawn 2 4 0 275 89 68.75 523 52.58 0 3 0 20 4 All 22 42 0 1,434 127 34.14 2,555 56.12 1 11 3 146 17
Sikandar Raza: Test bowling by match result Mat Inns Balls Mdns Runs Wkts BBI Avg Econ SR 4w 5w Won 3 5 222 3 103 7 3/35 14.71 2.78 31.71 0 0 Lost 16 23 2,375 35 1,404 20 3/30 70.20 3.54 118.75 0 0 Drawn 2 3 737 29 275 13 7/113 21.15 2.23 56.69 0 2 All 22 31 3,334 67 1,782 40 7/113 44.55 3.20 83.35 0 2
Sikandar Raza: Test batting by year Mat Inns NO Runs HS Avg BF SR 100 50 0 4s 6s 2013 1 2 0 84 60 42.00 172 48.83 0 1 0 12 0 2014 3 6 0 243 82 40.50 379 64.11 0 3 0 30 4 2016 2 4 0 62 37 15.50 118 52.54 0 0 1 11 0 2017 4 8 0 373 127 46.62 700 53.28 1 2 1 26 5 2018 2 4 0 56 25 14.00 127 44.09 0 0 1 6 1 2020 3 6 0 219 72 36.50 426 51.40 0 1 0 21 3 2021 2 3 0 150 85 50.00 230 65.21 0 1 0 12 4 2025 5 9 0 247 65 27.44 403 61.29 0 3 0 28 0 All 22 42 0 1,434 127 34.14 2,555 56.12 1 11 3 146 17
Sikandar Raza: Test bowling by year Mat Inns Balls Mdns Runs Wkts BBI Avg Econ SR 4w 5w 2014 3 6 492 4 303 5 3/123 60.60 3.69 98.40 0 0 2016 2 2 179 4 123 1 1/106 123.00 4.12 179.00 0 0 2017 4 6 684 20 337 7 5/99 48.14 2.95 97.71 0 1 2018 2 4 348 4 226 7 3/35 32.28 3.89 49.71 0 0 2020 3 4 725 19 349 12 7/113 29.08 2.88 60.41 0 1 2021 2 3 228 4 103 2 1/8 51.50 2.71 114.00 0 0 2025 5 6 678 12 341 6 3/30 56.83 3.01 113.00 0 0 All 22 31 3,334 67 1,782 40 7/113 44.55 3.20 83.35 0 2
Sikandar Raza: Test batting by ground Mat Inns NO Runs HS Avg BF SR 100 50 0 4s 6s Queens Sports Club 7 14 0 382 89 27.28 786 48.60 0 3 1 36 3 Harare Sports Club 4 7 0 313 72 44.71 553 56.60 0 3 0 34 2 Shere Bangla National Stadium 3 6 0 143 51 23.83 332 43.07 0 1 1 16 3 Sheikh Zayed Stadium 2 3 0 150 85 50.00 230 65.21 0 1 0 12 4 All 22 42 0 1,434 127 34.14 2,555 56.12 1 11 3 146 17
Sikandar Raza: Test bowling by ground Mat Inns Balls Mdns Runs Wkts BBI Avg Econ SR 4w 5w Queens Sports Club 7 9 1,175 32 562 13 5/99 43.23 2.86 90.38 0 1 Shere Bangla National Stadium 3 5 378 3 274 3 1/12 91.33 4.34 126.00 0 0 Harare Sports Club 3 4 551 17 241 11 7/113 21.90 2.62 50.09 0 1 Sheikh Zayed Stadium 2 3 228 4 103 2 1/8 51.50 2.71 114.00 0 0 All 22 31 3,334 67 1,782 40 7/113 44.55 3.20 83.35 0 2
Sikandar Raza: Test batting by series and tournaments Mat Inns NO Runs HS Avg BF SR 100 50 0 4s 6s Zimbabwe in Bangladesh Test Series 3 6 0 243 82 40.50 379 64.11 0 3 0 30 4 Zimbabwe tour of Bangladesh 3 6 0 111 37 18.50 260 42.69 0 0 1 12 2 New Zealand in Zimbabwe Test Series 2 4 0 62 37 15.50 118 52.54 0 0 1 11 0 New Zealand tour of Zimbabwe 2 4 0 16 5 4.00 41 39.02 0 0 0 3 0 Sri Lanka tour of Zimbabwe 2 4 0 164 72 41.00 293 55.97 0 1 0 15 2 West Indies tour of Zimbabwe 2 4 0 205 89 51.25 440 46.59 0 2 0 14 3 All 22 42 0 1,434 127 34.14 2,555 56.12 1 11 3 146 17
Sikandar Raza: Test bowling by series and tournaments Mat Inns Balls Mdns Runs Wkts BBI Avg Econ SR 4w 5w Zimbabwe in Bangladesh Test Series 3 6 492 4 303 5 3/123 60.60 3.69 98.40 0 0 Zimbabwe tour of Bangladesh 3 5 528 6 337 8 3/35 42.12 3.82 66.00 0 0 Sri Lanka tour of Zimbabwe 2 3 545 17 238 11 7/113 21.63 2.62 49.54 0 1 West Indies tour of Zimbabwe 2 3 468 17 194 7 5/99 27.71 2.48 66.85 0 1 All 22 31 3,334 67 1,782 40 7/113 44.55 3.20 83.35 0 2
- not recorded in the scorecards · N/A no dismissals or balls to divide by
Best Test performances Sikandar Raza: highest Test scores Score BF SR 4s 6s Opponent Ground Date 127 205 61.95 9 1 Sri Lanka R Premadasa Stadium 2017-07-14 89 203 43.84 6 1 West Indies Queens Sports Club 2017-10-29 85 129 65.89 7 1 Afghanistan Sheikh Zayed Stadium 2021-03-10 82 111 73.87 10 0 Bangladesh Zahur Ahmed Chowdhury Stadium 2014-11-12 80 147 54.42 6 1 West Indies Queens Sports Club 2017-10-29 72 99 72.72 4 2 Sri Lanka Harare Sports Club 2020-01-27 65 75 86.66 9 2 Bangladesh Zahur Ahmed Chowdhury Stadium 2014-11-12 65 88 73.86 7 0 Afghanistan Harare Sports Club 2025-10-20 61 104 58.65 6 0 Afghanistan Queens Sports Club 2025-01-02 60 118 50.84 10 0 Pakistan Harare Sports Club 2013-09-03
Sikandar Raza: best Test bowling Figures Balls Mdns Econ Opponent Ground Date 7/113 257 7 2.63 Sri Lanka Harare Sports Club 2020-01-27 5/99 288 12 2.06 West Indies Queens Sports Club 2017-10-29 3/30 72 2 2.50 Afghanistan Queens Sports Club 2025-01-02 3/35 72 2 2.91 Bangladesh Sylhet International Cricket Stadium 2018-11-03 3/41 102 1 2.41 Bangladesh Sylhet International Cricket Stadium 2018-11-03 3/62 96 0 3.87 Sri Lanka Harare Sports Club 2020-01-19 3/123 216 2 3.41 Bangladesh Zahur Ahmed Chowdhury Stadium 2014-11-12 1/8 18 0 2.66 Afghanistan Sheikh Zayed Stadium 2021-03-02 1/12 18 0 4.00 Bangladesh Shere Bangla National Stadium 2014-10-25 1/39 42 0 5.57 Bangladesh Shere Bangla National Stadium 2018-11-11
Latest Test matches Latest Test matches Date Opponent Bat Bowl Ground Result 2025-10-20 Afghanistan 65 0/3 Harare Sports Club Zimbabwe won by inns & 73 runs 2025-08-07 New Zealand 5 & 4 0/73 Queens Sports Club New Zealand won by an innings and 359 runs 2025-07-30 New Zealand 2 & 5 1/63 Queens Sports Club New Zealand won by 9 wickets 2025-05-22 England 7 & 60 1/93 Trent Bridge England won by an innings and 45 runs 2025-01-02 Afghanistan 61 & 38 3/30 & 1/79 Queens Sports Club Afghanistan won by 72 runs 2021-03-10 Afghanistan 85 & 22 1/79 Sheikh Zayed Stadium Afghanistan won by 6 wickets 2021-03-02 Afghanistan 43 1/8 & 0/16 Sheikh Zayed Stadium Zimbabwe won by 10 wickets 2020-02-22 Bangladesh 18 & 37 1/111 Shere Bangla National Stadium Bangladesh won by an innings and 106 runs 2020-01-27 Sri Lanka 72 & 34 7/113 & 1/63 Harare Sports Club Match drawn 2020-01-19 Sri Lanka 41 & 17 3/62 Harare Sports Club Sri Lanka won by 10 wickets
4,824 Runs
37.39 Average
85.51 Strike rate
7 Hundreds 85th among men
27 Fifties
141 Highest
Recent scores Oldest on the left. Recorded scorecards only. The top edge marks the result for their side.
Last 12 batting innings 557 Runs
55.70 Average
82.88 Strike rate
Last 12 bowling innings 8 Wickets
2/28 Best
5.05 Economy
Official ODI record Official ODI batting record Batting Mat Inns NO Runs HS Avg BF SR 100 50 0 4s 6s Career 162 153 24 4,824 141 37.39 5,641 85.51 7 27 3 400 112
Official ODI bowling record Bowling Mat Inns Balls Mdns Runs Wkts BBI BBM Avg Econ SR 4w 5w 10w Career 162 130 5,468 26 4,445 101 4/55 4/55 44.00 4.87 54.13 1 0 -
Official ODI fielding record Fielding Mat Inns Ct St Dis Dis/Inns Best Career 162 158 64 0 64 0.405 3 (3ct 0st)
ODI career in charts ODI batting form: average over 20 innings 20 40 60 Overall 37.4 Best spell: 56.0 up to 2023-06-26 Best 56.0 Latest: 42.5 2014 2017 2020 2023 2026 ODI runs by year 0 300 600 2013: 179 runs 179 2013 2014: 399 runs 399 2015: 814 runs 814 2015 2016: 241 runs 241 2017: 211 runs 211 2017 2018: 633 runs 633 2019: 179 runs 179 2019 2020: 200 runs 200 2021: 155 runs 155 2021 2022: 645 runs 645 2023: 487 runs 487 2023 2024: 116 runs 116 2025: 217 runs 217 2025 2026: 348 runs 348 2026 Last 20 ODI innings
0 1-49 50-99 100+ * not out
ODI innings by score How ODI innings ended Caught 86 · 56.2%
Bowled 24 · 15.7%
LBW 9 · 5.9%
Run out 4 · 2.6%
Stumped 4 · 2.6%
Caught and bowled 2 · 1.3%
Not out 24 · 15.7%
ODI batting position: average and innings ODI runs from boundaries Fours 1,600 · 33.2%
Sixes 672 · 13.9%
Other runs 2,552 · 52.9%
ODI bowling form: wickets per innings over 20 innings 1 Overall 0.78 Best spell: 1.40 up to 2019-04-14 Best 1.40 Latest: 0.75 2015 2017 2019 2021 2023 2025 ODI wickets by year 0 6 12 18 2014: 3 wickets 3 2014 2015: 17 wickets 17 2016: 3 wickets 3 2016 2017: 8 wickets 8 2018: 22 wickets 22 2018 2019: 6 wickets 6 2020: 2 wickets 2 2020 2021: 1 wicket 1 2022: 8 wickets 8 2022 2023: 15 wickets 15 2024: 7 wickets 7 2024 2025: 2 wickets 2 2026: 7 wickets 7 2026 Last 20 ODI bowling innings
ODI innings by wickets
ODI record by situation complete career Opposition Home and away Batting first or chasing Batting position Match result Year Ground Series and tournaments Bowling first or defending
Sikandar Raza: ODI batting by opposition Mat Inns NO Runs HS Avg BF SR 100 50 0 4s 6s Afghanistan 28 28 4 914 141 38.08 1,191 76.74 1 5 0 73 25 Bangladesh 26 26 2 868 135* 36.16 1,094 79.34 2 4 1 67 23 Sri Lanka 18 18 6 505 92 42.08 508 99.40 0 5 0 47 8 Ireland 17 17 3 525 69* 37.50 584 89.89 0 5 0 39 10 India 13 13 0 388 115 29.84 485 80.00 1 1 0 31 9 Pakistan 13 13 1 330 100* 27.50 362 91.16 1 0 0 27 8 Australia 8 8 1 268 81* 38.28 349 76.79 0 2 0 28 2 Netherlands 6 6 3 238 102* 79.33 187 127.27 1 1 1 14 15 South Africa 5 5 0 99 35 19.80 133 74.43 0 0 1 15 1 United Arab Emirates 5 5 1 118 46 29.50 118 100.00 0 0 0 11 2 West Indies 5 5 1 269 77 67.25 295 91.18 0 3 0 23 2 Scotland 4 4 1 97 58* 32.33 139 69.78 0 1 0 9 1 New Zealand 2 2 1 105 100* 105.00 106 99.05 1 0 0 5 4 Hong Kong 1 1 0 10 10 10.00 14 71.42 0 0 0 0 0 Oman 1 1 0 42 42 42.00 49 85.71 0 0 0 6 0 United States of America 1 1 0 48 48 48.00 27 177.77 0 0 0 5 2 All 162 153 24 4,824 141 37.39 5,641 85.51 7 27 3 400 112
Sikandar Raza: ODI bowling by opposition Mat Inns Balls Mdns Runs Wkts BBI Avg Econ SR 4w 5w Afghanistan 23 23 930 6 688 18 3/40 38.22 4.43 51.66 0 0 Bangladesh 20 20 954 5 854 18 3/43 47.44 5.37 53.00 0 0 Sri Lanka 17 17 777 2 622 10 3/21 62.20 4.80 77.70 0 0 Ireland 15 15 640 2 515 8 3/49 64.37 4.82 80.00 0 0 Pakistan 11 11 392 1 337 10 3/59 33.70 5.15 39.20 0 0 India 7 7 233 1 176 4 1/7 44.00 4.53 58.25 0 0 Australia 6 6 264 0 247 4 2/42 61.75 5.61 66.00 0 0 Netherlands 6 6 264 0 237 9 4/55 26.33 5.38 29.33 1 0 United Arab Emirates 6 6 294 3 191 7 3/41 27.28 3.89 42.00 0 0 West Indies 5 5 210 2 190 3 2/36 63.33 5.42 70.00 0 0 Scotland 4 4 240 3 148 4 2/35 37.00 3.70 60.00 0 0 New Zealand 3 3 48 0 51 0 0/15 N/A 6.37 N/A 0 0 South Africa 3 3 36 0 43 0 0/9 N/A 7.16 N/A 0 0 Hong Kong 1 1 60 1 30 3 3/30 10.00 3.00 20.00 0 0 Nepal 1 1 36 0 44 0 0/44 N/A 7.33 N/A 0 0 Oman 1 1 60 0 57 1 1/57 57.00 5.70 60.00 0 0 United States of America 1 1 30 0 15 2 2/15 7.50 3.00 15.00 0 0 All 162 130 5,468 26 4,445 101 4/55 44.00 4.87 54.13 1 0
Sikandar Raza: ODI batting by home and away Mat Inns NO Runs HS Avg BF SR 100 50 0 4s 6s Home 91 91 16 3,139 141 41.85 3,692 85.02 6 16 3 262 64 Away 41 41 7 1,132 100* 33.29 1,328 85.24 1 8 0 90 30 Neutral 21 21 1 553 92 27.65 621 89.04 0 3 0 48 18 All 162 153 24 4,824 141 37.39 5,641 85.51 7 27 3 400 112
Sikandar Raza: ODI bowling by home and away Mat Inns Balls Mdns Runs Wkts BBI Avg Econ SR 4w 5w Home 72 72 2,936 11 2,334 60 4/55 38.90 4.76 48.93 1 0 Away 40 40 1,740 11 1,476 28 3/21 52.71 5.08 62.14 0 0 Neutral 18 18 792 4 635 13 2/28 48.84 4.81 60.92 0 0 All 162 130 5,468 26 4,445 101 4/55 44.00 4.87 54.13 1 0
Sikandar Raza: ODI batting by batting first or chasing Mat Inns NO Runs HS Avg BF SR 100 50 0 4s 6s Batting first 82 82 12 2,553 100* 36.47 3,035 84.11 2 19 1 201 61 Chasing 71 71 12 2,271 141 38.49 2,606 87.14 5 8 2 199 51 All 162 153 24 4,824 141 37.39 5,641 85.51 7 27 3 400 112
Sikandar Raza: ODI bowling by bowling first or defending Mat Inns Balls Mdns Runs Wkts BBI Avg Econ SR 4w 5w Bowling first 65 65 3,042 15 2,504 55 4/55 45.52 4.93 55.30 1 0 Defending a total 65 65 2,426 11 1,941 46 3/30 42.19 4.80 52.73 0 0 All 162 130 5,468 26 4,445 101 4/55 44.00 4.87 54.13 1 0
Sikandar Raza: ODI batting by batting position Mat Inns NO Runs HS Avg BF SR 100 50 0 4s 6s No. 1 3 3 0 88 46 29.33 101 87.12 0 0 0 13 1 No. 2 18 18 1 524 141 30.82 678 77.28 1 1 0 57 11 No. 3 5 5 0 93 37 18.60 132 70.45 0 0 1 14 0 No. 4 9 9 1 173 77 21.62 206 83.98 0 1 0 16 2 No. 5 56 56 11 2,176 135* 48.35 2,537 85.77 5 12 2 166 56 No. 6 50 50 7 1,422 86 33.06 1,618 87.88 0 12 0 111 30 No. 7 12 12 4 348 100* 43.50 369 94.30 1 1 0 23 12 All 162 153 24 4,824 141 37.39 5,641 85.51 7 27 3 400 112
Sikandar Raza: ODI batting by match result Mat Inns NO Runs HS Avg BF SR 100 50 0 4s 6s Won 42 42 15 1,844 141 68.29 1,883 97.92 4 11 1 157 50 Lost 105 105 7 2,837 115 28.94 3,603 78.73 3 15 2 231 61 Tied 3 3 0 123 77 41.00 119 103.36 0 1 0 11 1 No result 3 3 2 20 15 20.00 36 55.55 0 0 0 1 0 All 162 153 24 4,824 141 37.39 5,641 85.51 7 27 3 400 112
Sikandar Raza: ODI bowling by match result Mat Inns Balls Mdns Runs Wkts BBI Avg Econ SR 4w 5w Won 38 38 1,710 11 1,324 48 4/55 27.58 4.64 35.62 1 0 Lost 86 86 3,446 15 2,880 48 3/40 60.00 5.01 71.79 0 0 Tied 3 3 144 0 103 1 1/36 103.00 4.29 144.00 0 0 No result 3 3 168 0 138 4 3/59 34.50 4.92 42.00 0 0 All 162 130 5,468 26 4,445 101 4/55 44.00 4.87 54.13 1 0
Sikandar Raza: ODI batting by year Mat Inns NO Runs HS Avg BF SR 100 50 0 4s 6s 2013 8 8 0 179 82 22.37 277 64.62 0 1 0 17 2 2014 13 13 1 399 141 33.25 508 78.54 1 0 1 49 8 2015 28 28 4 814 100* 33.91 906 89.84 2 3 0 62 19 2016 10 10 2 241 77 30.12 346 69.65 0 2 0 17 1 2017 8 8 4 211 67* 52.75 254 83.07 0 2 0 22 4 2018 18 18 2 633 92 39.56 769 82.31 0 5 0 47 20 2019 8 8 2 179 85* 29.83 189 94.70 0 1 0 11 6 2020 6 6 0 200 66 33.33 190 105.26 0 2 0 17 5 2021 4 4 1 155 59* 51.66 161 96.27 0 2 0 14 3 2022 15 15 2 645 135* 49.61 740 87.16 3 2 1 44 17 2023 14 14 2 487 102* 40.58 450 108.22 1 1 1 41 18 2024 8 8 2 116 39 19.33 171 67.83 0 0 0 13 2 2025 4 4 1 217 92 72.33 225 96.44 0 3 0 19 1 2026 9 9 1 348 81* 43.50 455 76.48 0 3 0 27 6 All 162 153 24 4,824 141 37.39 5,641 85.51 7 27 3 400 112
Sikandar Raza: ODI bowling by year Mat Inns Balls Mdns Runs Wkts BBI Avg Econ SR 4w 5w 2014 7 7 144 0 143 3 2/25 47.66 5.95 48.00 0 0 2015 23 23 816 5 689 17 3/40 40.52 5.06 48.00 0 0 2016 8 8 230 2 179 3 2/37 59.66 4.66 76.66 0 0 2017 8 8 468 4 339 8 3/21 42.37 4.34 58.50 0 0 2018 16 16 816 5 649 22 3/30 29.50 4.77 37.09 0 0 2019 9 9 372 4 270 6 2/28 45.00 4.35 62.00 0 0 2020 6 6 306 1 289 2 1/23 144.50 5.66 153.00 0 0 2021 4 4 138 0 113 1 1/33 113.00 4.91 138.00 0 0 2022 14 14 540 2 453 8 3/56 56.62 5.03 67.50 0 0 2023 14 14 642 0 529 15 4/55 35.26 4.94 42.80 1 0 2024 8 8 320 2 219 7 2/7 31.28 4.10 45.71 0 0 2025 5 5 286 0 231 2 1/48 115.50 4.84 143.00 0 0 2026 8 8 390 1 342 7 2/28 48.85 5.26 55.71 0 0 All 162 130 5,468 26 4,445 101 4/55 44.00 4.87 54.13 1 0
Sikandar Raza: ODI batting by ground Mat Inns NO Runs HS Avg BF SR 100 50 0 4s 6s Harare Sports Club 64 64 12 2,297 135* 44.17 2,602 88.27 5 12 2 185 50 Queens Sports Club 27 27 4 842 141 36.60 1,090 77.24 1 4 1 77 14 Sharjah Cricket Stadium 11 11 0 286 92 26.00 331 86.40 0 2 0 20 12 Shere Bangla National Stadium 9 9 1 242 81* 30.25 352 68.75 0 2 0 21 5 Civil Service Cricket Club, Stormont 4 4 1 105 59* 35.00 89 117.97 0 1 0 8 3 Zahur Ahmed Chowdhury Stadium 4 4 0 120 49 30.00 158 75.94 0 0 0 8 3 Mahinda Rajapaksa International Cricket Stadium 3 3 2 62 27* 62.00 54 114.81 0 0 0 4 3 Pallekele International Cricket Stadium 3 3 0 75 56 25.00 68 110.29 0 1 0 6 1 Rawalpindi Cricket Stadium 3 3 0 55 45 18.33 51 107.84 0 0 0 5 1 Riverway Stadium 3 3 0 30 17 10.00 80 37.50 0 0 0 2 1 Sylhet International Cricket Stadium 3 3 0 145 66 48.33 139 104.31 0 2 0 12 4 All 162 153 24 4,824 141 37.39 5,641 85.51 7 27 3 400 112
Sikandar Raza: ODI bowling by ground Mat Inns Balls Mdns Runs Wkts BBI Avg Econ SR 4w 5w Harare Sports Club 52 52 2,181 8 1,779 42 4/55 42.35 4.89 51.92 1 0 Queens Sports Club 20 20 755 3 555 18 3/30 30.83 4.41 41.94 0 0 Sharjah Cricket Stadium 8 8 348 3 258 7 2/37 36.85 4.44 49.71 0 0 Shere Bangla National Stadium 8 8 390 3 355 7 2/47 50.71 5.46 55.71 0 0 Civil Service Cricket Club, Stormont 4 4 132 1 99 2 2/28 49.50 4.50 66.00 0 0 Gaddafi Stadium 3 3 96 0 107 3 3/59 35.66 6.68 32.00 0 0 Mahinda Rajapaksa International Cricket Stadium 3 3 174 1 132 4 3/21 33.00 4.55 43.50 0 0 R Premadasa Stadium 3 3 138 1 85 3 2/32 28.33 3.69 46.00 0 0 Rawalpindi Cricket Stadium 3 3 144 1 110 2 1/23 55.00 4.58 72.00 0 0 Riverway Stadium 3 3 84 0 83 1 1/45 83.00 5.92 84.00 0 0 Sylhet International Cricket Stadium 3 3 162 0 179 0 0/56 N/A 6.62 N/A 0 0 Zahur Ahmed Chowdhury Stadium 3 3 132 1 109 3 3/43 36.33 4.95 44.00 0 0 All 162 130 5,468 26 4,445 101 4/55 44.00 4.87 54.13 1 0
Sikandar Raza: ODI batting by series and tournaments Mat Inns NO Runs HS Avg BF SR 100 50 0 4s 6s India in Zimbabwe ODI Series 9 9 0 217 82 24.11 327 66.36 0 1 0 20 3 Bangladesh tour of Zimbabwe 8 8 2 384 135* 64.00 425 90.35 2 1 1 29 12 Ireland tour of Zimbabwe 7 7 0 188 58 26.85 212 88.67 0 1 0 16 2 ICC Cricket World Cup 6 6 0 125 46 20.83 126 99.20 0 0 0 15 4 ICC Cricket World Cup Qualifier 6 6 1 325 102* 65.00 279 116.48 1 1 0 28 14 Zimbabwe in Bangladesh ODI Series 6 6 0 85 33 14.16 139 61.15 0 0 0 8 1 Zimbabwe tour of Bangladesh 6 6 0 241 66 40.16 273 88.27 0 2 0 17 7 ICC Cricket World Cup Qualifier (ICC Trophy) 5 5 1 136 69* 34.00 158 86.07 0 1 0 8 4 Zimbabwe Tri-Nation Series 5 5 2 163 77 54.33 209 77.99 0 2 0 11 0 Zimbabwe in Sri Lanka ODI Series 5 5 3 137 67* 68.50 127 107.87 0 1 0 13 4 Zimbabwe tour of Netherlands and Ireland 5 5 1 141 85* 35.25 141 100.00 0 1 0 8 6 Zimbabwe tour of Sri Lanka 5 5 0 86 56 17.20 84 102.38 0 1 0 7 1 All 162 153 24 4,824 141 37.39 5,641 85.51 7 27 3 400 112
Sikandar Raza: ODI bowling by series and tournaments Mat Inns Balls Mdns Runs Wkts BBI Avg Econ SR 4w 5w Bangladesh tour of Zimbabwe 7 7 330 1 281 7 3/56 40.14 5.10 47.14 0 0 ICC Cricket World Cup Qualifier 7 7 336 0 268 9 4/55 29.77 4.78 37.33 1 0 Ireland tour of Zimbabwe 7 7 334 0 273 2 1/47 136.50 4.90 167.00 0 0 ICC Cricket World Cup 6 6 240 1 197 2 1/34 98.50 4.92 120.00 0 0 Zimbabwe tour of Bangladesh 6 6 318 1 306 3 3/43 102.00 5.77 106.00 0 0 ICC Cricket World Cup Qualifier (ICC Trophy) 5 5 246 1 176 9 3/30 19.55 4.29 27.33 0 0 Zimbabwe in Sri Lanka ODI Series 5 5 288 1 224 4 3/21 56.00 4.66 72.00 0 0 Zimbabwe tour of Netherlands and Ireland 5 5 156 1 131 2 2/28 65.50 5.03 78.00 0 0 Zimbabwe tour of Sri Lanka 5 5 198 1 141 4 2/32 35.25 4.27 49.50 0 0 Tri-Nation Tournament in Bangladesh 4 4 222 2 190 4 2/53 47.50 5.13 55.50 0 0 Zimbabwe Tri-Nation Series 4 4 93 1 89 0 0/13 N/A 5.74 N/A 0 0 Zimbabwe in Bangladesh ODI Series 4 4 144 1 147 3 2/47 49.00 6.12 48.00 0 0 All 162 130 5,468 26 4,445 101 4/55 44.00 4.87 54.13 1 0
Sikandar Raza: ODI batting by batting first or chasing Mat Inns NO Runs HS Avg BF SR 100 50 0 4s 6s Batting first 82 82 12 2,553 100* 36.47 3,035 84.11 2 19 1 201 61 Chasing 71 71 12 2,271 141 38.49 2,606 87.14 5 8 2 199 51 All 162 153 24 4,824 141 37.39 5,641 85.51 7 27 3 400 112
Sikandar Raza: ODI bowling by bowling first or defending Mat Inns Balls Mdns Runs Wkts BBI Avg Econ SR 4w 5w Bowling first 65 65 3,042 15 2,504 55 4/55 45.52 4.93 55.30 1 0 Defending a total 65 65 2,426 11 1,941 46 3/30 42.19 4.80 52.73 0 0 All 162 130 5,468 26 4,445 101 4/55 44.00 4.87 54.13 1 0
- not recorded in the scorecards · N/A no dismissals or balls to divide by
Best ODI performances Sikandar Raza: highest ODI scores Score BF SR 4s 6s Opponent Ground Date 141 133 106.01 11 7 Afghanistan Queens Sports Club 2014-07-20 135* 109 123.85 8 6 Bangladesh Harare Sports Club 2022-08-05 117* 127 92.12 8 4 Bangladesh Harare Sports Club 2022-08-07 115 95 121.05 9 3 India Harare Sports Club 2022-08-22 102* 54 188.88 6 8 Netherlands Harare Sports Club 2023-06-20 100* 84 119.04 8 3 Pakistan Gaddafi Stadium 2015-05-29 100* 95 105.26 5 4 New Zealand Harare Sports Club 2015-08-04 92 74 124.32 9 4 Afghanistan Sharjah Cricket Stadium 2018-02-11 92 87 105.74 8 0 Sri Lanka Harare Sports Club 2025-08-29 86 113 76.10 5 1 Afghanistan Queens Sports Club 2015-10-22
Sikandar Raza: best ODI bowling Figures Balls Mdns Econ Opponent Ground Date 4/55 60 0 5.50 Netherlands Harare Sports Club 2023-06-20 3/21 60 1 2.10 Sri Lanka Mahinda Rajapaksa International Cricket Stadium 2017-07-10 3/30 60 1 3.00 Hong Kong Queens Sports Club 2018-03-10 3/39 54 0 4.33 Netherlands Harare Sports Club 2023-03-23 3/40 60 0 4.00 Afghanistan Queens Sports Club 2015-10-24 3/40 60 1 4.00 Afghanistan Queens Sports Club 2018-03-06 3/41 60 0 4.10 United Arab Emirates Harare Sports Club 2018-03-22 3/43 60 1 4.30 Bangladesh Zahur Ahmed Chowdhury Stadium 2018-10-24 3/49 60 1 4.90 Ireland Harare Sports Club 2015-10-11 3/56 60 0 5.60 Bangladesh Harare Sports Club 2022-08-07
Latest ODI matches Latest ODI matches Date Opponent Bat Bowl Ground Result 2026-10-23 Afghanistan 68 0/17 Sharjah Cricket Stadium Afghanistan won by 7 wickets 2026-10-19 Afghanistan 48 1/54 Sheikh Zayed Stadium Afghanistan won by 158 runs 2026-10-17 Bangladesh 4 2/28 Sheikh Zayed Stadium Zimbabwe won by 99 runs 2026-09-20 Australia 81* 2/42 Harare Sports Club Australia won by 1 wicket 2026-09-18 Australia 45 0/60 Harare Sports Club Australia won by 84 runs 2026-09-15 Australia 57 1/62 Harare Sports Club Australia won by 59 runs 2026-07-11 Bangladesh 11 0/28 Harare Sports Club Bangladesh won by 7 wickets 2026-07-09 Bangladesh 33 1/51 Harare Sports Club Zimbabwe won by 13 runs 2026-07-06 Bangladesh 1 - Harare Sports Club Zimbabwe won by 25 runs 2025-08-31 Sri Lanka 59* 0/46 Harare Sports Club Sri Lanka won by 5 wickets
3,369 Runs 10th among men
26.11 Average
136.50 Strike rate
2 Hundreds 21st among men
17 Fifties
133* Highest
Recent scores Oldest on the left. Recorded scorecards only. The top edge marks the result for their side.
Last 12 batting innings 232 Runs
21.09 Average
124.06 Strike rate
1 Hundreds
Last 12 bowling innings 9 Wickets
2/38 Best
8.60 Economy
Official T20I record Official T20I batting record Batting Mat Inns NO Runs HS Avg BF SR 100 50 0 4s 6s Career 147 142 13 3,369 133* 26.11 2,468 136.50 2 17 12 258 161
Official T20I bowling record Bowling Mat Inns Balls Mdns Runs Wkts BBI BBM Avg Econ SR 4w 5w 10w Career 147 132 2,496 5 2,948 116 5/18 5/18 25.41 7.08 21.51 2 1 -
Official T20I fielding record Fielding Mat Inns Ct St Dis Dis/Inns Best Career 147 145 66 0 66 0.455 3 (3ct 0st)
T20I career in charts T20I batting form: average over 20 innings 20 40 60 Overall 26.1 Best spell: 44.1 up to 2023-10-29 Best 44.1 Latest: 28.6 2016 2021 2023 2025 T20I runs by year 0 200 400 600 2013: 45 runs 45 2013 2014: 32 runs 32 2015: 181 runs 181 2015 2016: 83 runs 83 2017: 0 runs 2017 2018: 41 runs 41 2019: 24 runs 24 2019 2020: 36 runs 36 2021: 82 runs 82 2021 2022: 735 runs 735 2023: 515 runs 515 2023 2024: 573 runs 573 2025: 536 runs 536 2025 2026: 486 runs 486 2026 Last 20 T20I innings
0 1-49 50-99 100+ * not out
T20I innings by score How T20I innings ended Caught 94 · 66.2%
Bowled 17 · 12.0%
LBW 5 · 3.5%
Run out 4 · 2.8%
Stumped 7 · 4.9%
Caught and bowled 2 · 1.4%
Not out 13 · 9.2%
T20I batting position: average and innings T20I runs from boundaries Fours 1,032 · 30.6%
Sixes 966 · 28.7%
Other runs 1,371 · 40.7%
T20I bowling form: wickets per innings over 20 innings 1 Overall 0.88 Best spell: 1.45 up to 2024-01-14 Best 1.45 Latest: 0.70 2019 2023 2025 T20I wickets by year 0 7 14 21 2014: 2 wickets 2 2014 2015: 1 wicket 1 2016: 6 wickets 6 2016 2017: 0 wickets 2018: 0 wickets 2018 2019: 2 wickets 2 2020: 1 wicket 1 2020 2021: 1 wicket 1 2022: 25 wickets 25 2022 2023: 17 wickets 17 2024: 24 wickets 24 2024 2025: 23 wickets 23 2026: 14 wickets 14 2026 Last 20 T20I bowling innings
T20I innings by wickets
T20I record by situation complete career Opposition Home and away Batting first or chasing Batting position Match result Year Ground Series and tournaments Bowling first or defending
Sikandar Raza: T20I batting by opposition Mat Inns NO Runs HS Avg BF SR 100 50 0 4s 6s Bangladesh 24 24 2 366 72* 16.63 293 124.91 0 3 5 34 14 Afghanistan 22 22 2 584 106* 29.20 416 140.38 1 2 1 46 24 Namibia 16 16 2 335 82* 23.92 267 125.46 0 2 2 19 18 India 14 14 0 198 46 14.14 179 110.61 0 0 2 16 6 Pakistan 11 11 1 207 39 20.70 184 112.50 0 0 0 17 3 Sri Lanka 9 9 0 267 62 29.66 193 138.34 0 1 0 23 11 Ireland 7 7 0 216 82 30.85 159 135.84 0 2 1 16 9 South Africa 7 7 1 207 73 34.50 163 126.99 0 2 1 17 9 Netherlands 5 5 0 93 40 18.60 71 130.98 0 0 0 7 5 Kenya 3 3 0 119 82 39.66 94 126.59 0 1 0 3 9 New Zealand 3 3 0 29 12 9.66 33 87.87 0 0 0 4 0 Rwanda 2 2 0 61 58 30.50 41 148.78 0 1 0 6 4 Scotland 2 2 0 49 40 24.50 32 153.12 0 0 0 4 2 Uganda 2 2 0 72 48 36.00 55 130.90 0 0 0 4 4 West Indies 2 2 0 41 27 20.50 28 146.42 0 0 0 3 3 Australia 1 1 1 25 25* N/A 13 192.30 0 0 0 2 1 Botswana 1 1 0 21 21 21.00 10 210.00 0 0 0 1 2 Gambia 1 1 1 133 133* N/A 43 309.30 1 0 0 7 15 Hong Kong 1 1 0 3 3 3.00 4 75.00 0 0 0 0 0 Jersey 1 1 0 18 18 18.00 21 85.71 0 0 0 0 1 Nigeria 1 1 0 65 65 65.00 37 175.67 0 1 0 4 7 Oman 1 1 1 5 5* N/A 2 250.00 0 0 0 1 0 Papua New Guinea 1 1 0 22 22 22.00 14 157.14 0 0 0 2 0 Seychelles 1 1 1 36 36* N/A 13 276.92 0 0 0 5 2 Singapore 1 1 0 87 87 87.00 40 217.50 0 1 0 8 5 Tanzania 1 1 0 19 19 19.00 9 211.11 0 0 0 1 2 United Arab Emirates 1 1 0 9 9 9.00 14 64.28 0 0 0 1 0 United States of America 1 1 1 82 82* N/A 40 205.00 0 1 0 7 5 All 147 142 13 3,369 133* 26.11 2,468 136.50 2 17 12 258 161
Sikandar Raza: T20I bowling by opposition Mat Inns Balls Mdns Runs Wkts BBI Avg Econ SR 4w 5w Bangladesh 20 20 384 0 495 13 2/7 38.07 7.73 29.53 0 0 Afghanistan 19 19 348 0 413 11 3/20 37.54 7.12 31.63 0 0 Namibia 17 17 346 0 427 18 4/24 23.72 7.40 19.22 1 0 India 14 14 246 0 330 9 3/25 36.66 8.04 27.33 0 0 Pakistan 11 11 180 0 235 7 3/25 33.57 7.83 25.71 0 0 Sri Lanka 9 9 209 0 205 9 3/11 22.77 5.88 23.22 0 0 South Africa 7 7 124 0 183 4 3/29 45.75 8.85 31.00 0 0 Ireland 4 4 72 0 86 6 3/28 14.33 7.16 12.00 0 0 Netherlands 4 4 78 1 68 6 4/8 11.33 5.23 13.00 1 0 Kenya 3 3 72 0 56 5 3/17 11.20 4.66 14.40 0 0 New Zealand 3 3 60 0 89 0 0/23 N/A 8.90 N/A 0 0 Rwanda 2 2 40 1 21 8 5/18 2.62 3.15 5.00 0 1 Scotland 2 2 36 0 39 1 1/20 39.00 6.50 36.00 0 0 Tanzania 2 2 36 0 16 5 3/10 3.20 2.66 7.20 0 0 Uganda 2 2 37 0 41 1 1/22 41.00 6.64 37.00 0 0 West Indies 2 2 42 0 71 3 3/19 23.66 10.14 14.00 0 0 Australia 1 1 12 0 17 0 0/17 N/A 8.50 N/A 0 0 Botswana 1 1 24 2 14 1 1/14 14.00 3.50 24.00 0 0 Hong Kong 1 1 12 0 10 1 1/10 10.00 5.00 12.00 0 0 Mozambique 1 1 18 0 10 2 2/10 5.00 3.33 9.00 0 0 Nigeria 1 1 18 1 13 2 2/13 6.50 4.33 9.00 0 0 Oman 1 1 24 0 17 1 1/17 17.00 4.25 24.00 0 0 Papua New Guinea 1 1 12 0 22 1 1/22 22.00 11.00 12.00 0 0 Seychelles 1 1 18 0 14 0 0/14 N/A 4.66 N/A 0 0 Singapore 1 1 6 0 9 0 0/9 N/A 9.00 N/A 0 0 United Arab Emirates 1 1 18 0 15 2 2/15 7.50 5.00 9.00 0 0 United States of America 1 1 24 0 32 0 0/32 N/A 8.00 N/A 0 0 All 147 132 2,496 5 2,948 116 5/18 25.41 7.08 21.51 2 1
Sikandar Raza: T20I batting by home and away Mat Inns NO Runs HS Avg BF SR 100 50 0 4s 6s Home 68 68 4 1,457 87 22.76 1,122 129.85 0 8 8 113 53 Away 34 34 3 660 82* 21.29 521 126.67 0 4 2 53 31 Neutral 40 40 6 1,252 133* 36.82 825 151.75 2 5 2 92 77 All 147 142 13 3,369 133* 26.11 2,468 136.50 2 17 12 258 161
Sikandar Raza: T20I bowling by home and away Mat Inns Balls Mdns Runs Wkts BBI Avg Econ SR 4w 5w Home 62 62 1,192 3 1,337 51 4/8 26.21 6.72 23.37 1 0 Away 33 33 633 0 828 25 4/24 33.12 7.84 25.32 1 0 Neutral 37 37 671 2 783 40 5/18 19.57 7.00 16.77 0 1 All 147 132 2,496 5 2,948 116 5/18 25.41 7.08 21.51 2 1
Sikandar Raza: T20I batting by batting first or chasing Mat Inns NO Runs HS Avg BF SR 100 50 0 4s 6s Batting first 78 78 8 1,924 133* 27.48 1,372 140.23 1 11 7 146 96 Chasing 64 64 5 1,445 106* 24.49 1,096 131.84 1 6 5 112 65 All 147 142 13 3,369 133* 26.11 2,468 136.50 2 17 12 258 161
Sikandar Raza: T20I bowling by bowling first or defending Mat Inns Balls Mdns Runs Wkts BBI Avg Econ SR 4w 5w Bowling first 63 63 1,320 1 1,595 63 4/24 25.31 7.25 20.95 1 0 Defending a total 69 69 1,176 4 1,353 53 5/18 25.52 6.90 22.18 1 1 All 147 132 2,496 5 2,948 116 5/18 25.41 7.08 21.51 2 1
Sikandar Raza: T20I batting by batting position Mat Inns NO Runs HS Avg BF SR 100 50 0 4s 6s No. 1 6 6 0 273 82 45.50 173 157.80 0 4 0 18 20 No. 2 4 4 0 53 21 13.25 47 112.76 0 0 0 8 1 No. 3 8 8 2 234 106* 39.00 155 150.96 1 1 1 17 15 No. 4 63 63 6 1,566 133* 27.47 1,115 140.44 1 8 6 122 73 No. 5 53 53 5 1,080 87 22.50 832 129.80 0 4 5 83 47 No. 6 8 8 0 163 45 20.37 146 111.64 0 0 0 10 5 All 147 142 13 3,369 133* 26.11 2,468 136.50 2 17 12 258 161
Sikandar Raza: T20I batting by match result Mat Inns NO Runs HS Avg BF SR 100 50 0 4s 6s Won 53 53 9 1,578 133* 35.86 1,006 156.85 1 11 3 115 93 Lost 85 85 4 1,750 106* 21.60 1,421 123.15 1 6 7 141 66 Tied 1 1 0 7 7 7.00 11 63.63 0 0 0 0 0 No result 3 3 0 34 34 11.33 30 113.33 0 0 2 2 2 All 147 142 13 3,369 133* 26.11 2,468 136.50 2 17 12 258 161
Sikandar Raza: T20I bowling by match result Mat Inns Balls Mdns Runs Wkts BBI Avg Econ SR 4w 5w Won 51 51 1,036 5 1,056 63 5/18 16.76 6.11 16.44 1 1 Lost 79 79 1,430 0 1,856 52 4/24 35.69 7.78 27.50 1 0 Tied 1 1 24 0 25 1 1/25 25.00 6.25 24.00 0 0 No result 1 1 6 0 11 0 0/11 N/A 11.00 N/A 0 0 All 147 132 2,496 5 2,948 116 5/18 25.41 7.08 21.51 2 1
Sikandar Raza: T20I batting by year Mat Inns NO Runs HS Avg BF SR 100 50 0 4s 6s 2013 2 2 0 45 31 22.50 44 102.27 0 0 0 1 2 2014 3 3 0 32 13 10.66 34 94.11 0 0 0 5 0 2015 10 10 0 181 59 18.10 158 114.55 0 1 0 17 3 2016 10 10 0 83 20 8.30 93 89.24 0 0 0 5 1 2018 2 2 0 41 40 20.50 28 146.42 0 0 0 5 1 2019 3 3 0 24 14 8.00 27 88.88 0 0 0 1 1 2020 4 4 0 36 12 9.00 39 92.30 0 0 0 6 0 2021 6 6 1 82 41* 16.40 67 122.38 0 0 2 7 1 2022 23 23 2 735 87 35.00 487 150.92 0 5 4 52 38 2023 11 11 1 515 82* 51.50 343 150.14 0 6 0 29 39 2024 23 23 3 573 133* 28.65 391 146.54 1 2 1 48 29 2025 25 25 3 536 54* 24.36 420 127.61 0 2 2 46 18 2026 20 20 3 486 106* 28.58 337 144.21 1 1 3 36 28 All 147 142 13 3,369 133* 26.11 2,468 136.50 2 17 12 258 161
Sikandar Raza: T20I bowling by year Mat Inns Balls Mdns Runs Wkts BBI Avg Econ SR 4w 5w 2014 1 1 18 0 15 2 2/15 7.50 5.00 9.00 0 0 2015 7 7 72 0 102 1 1/19 102.00 8.50 72.00 0 0 2016 10 10 120 0 165 6 2/7 27.50 8.25 20.00 0 0 2018 1 1 12 0 26 0 0/26 N/A 13.00 N/A 0 0 2019 3 3 54 0 68 2 1/25 34.00 7.55 27.00 0 0 2020 4 4 60 0 88 1 1/31 88.00 8.80 60.00 0 0 2021 6 6 78 0 107 1 1/14 107.00 8.23 78.00 0 0 2022 23 23 432 1 442 25 4/8 17.68 6.13 17.28 1 0 2023 12 12 231 1 253 17 4/24 14.88 6.57 13.58 1 0 2024 23 23 491 1 534 24 5/18 22.25 6.52 20.45 0 1 2025 23 23 508 2 539 23 3/11 23.43 6.36 22.08 0 0 2026 19 19 420 0 609 14 3/29 43.50 8.70 30.00 0 0 All 147 132 2,496 5 2,948 116 5/18 25.41 7.08 21.51 2 1
Sikandar Raza: T20I batting by ground Mat Inns NO Runs HS Avg BF SR 100 50 0 4s 6s Harare Sports Club 46 46 2 883 65* 20.06 712 124.01 0 5 8 70 31 Queens Sports Club 22 22 2 574 87 28.70 410 140.00 0 3 0 43 22 Sharjah Cricket Stadium 7 7 1 186 106* 31.00 129 144.18 1 0 0 12 12 Rawalpindi Cricket Stadium 6 6 1 155 47 31.00 118 131.35 0 0 0 15 5 Shere Bangla National Stadium 6 6 1 120 72* 24.00 91 131.86 0 1 0 16 4 United Cricket Club Ground 6 6 0 251 82 41.83 174 144.25 0 3 0 11 22 Namibia Cricket Ground 5 5 0 100 45 20.00 93 107.52 0 0 1 7 3 R Premadasa Stadium 5 5 1 150 62 37.50 98 153.06 0 1 0 12 7 Bellerive Oval 4 4 0 136 82 34.00 81 167.90 0 1 1 9 8 Wanderers Cricket Ground 4 4 1 199 82* 66.33 127 156.69 0 2 0 13 15 Sheikh Abu Naser Stadium 3 3 0 15 7 5.00 19 78.94 0 0 0 1 0 Sheikh Zayed Stadium 3 3 1 78 41* 39.00 56 139.28 0 0 0 7 1 Sylhet International Cricket Stadium 3 3 0 32 13 10.66 34 94.11 0 0 0 5 0 Vidarbha Cricket Association Stadium 3 3 0 27 15 9.00 30 90.00 0 0 0 1 0 Zahur Ahmed Chowdhury Stadium 3 3 0 4 3 1.33 14 28.57 0 0 1 0 0 All 147 142 13 3,369 133* 26.11 2,468 136.50 2 17 12 258 161
Sikandar Raza: T20I bowling by ground Mat Inns Balls Mdns Runs Wkts BBI Avg Econ SR 4w 5w Harare Sports Club 43 43 826 2 941 30 3/11 31.36 6.83 27.53 0 0 Queens Sports Club 19 19 366 1 396 21 4/8 18.85 6.49 17.42 1 0 United Cricket Club Ground 7 7 145 1 144 11 4/24 13.09 5.95 13.18 1 0 Rawalpindi Cricket Stadium 6 6 120 0 147 3 2/39 49.00 7.35 40.00 0 0 Namibia Cricket Ground 5 5 114 0 151 3 1/27 50.33 7.94 38.00 0 0 R Premadasa Stadium 5 5 101 0 116 3 3/13 38.66 6.89 33.66 0 0 Sharjah Cricket Stadium 5 5 84 0 156 3 1/27 52.00 11.14 28.00 0 0 Bellerive Oval 4 4 72 0 72 5 3/19 14.40 6.00 14.40 0 0 Shere Bangla National Stadium 4 4 84 0 99 2 1/24 49.50 7.07 42.00 0 0 Wanderers Cricket Ground 4 4 62 0 81 3 3/3 27.00 7.83 20.66 0 0 Gymkhana Club Ground 3 3 60 0 41 5 3/17 8.20 4.10 12.00 0 0 Sheikh Abu Naser Stadium 3 3 36 0 50 4 2/7 12.50 8.33 9.00 0 0 Sheikh Zayed Stadium 3 3 42 0 56 1 1/14 56.00 8.00 42.00 0 0 Vidarbha Cricket Association Stadium 3 3 36 0 44 1 1/10 44.00 7.33 36.00 0 0 Zahur Ahmed Chowdhury Stadium 3 3 72 0 100 1 1/38 100.00 8.33 72.00 0 0 All 147 132 2,496 5 2,948 116 5/18 25.41 7.08 21.51 2 1
Sikandar Raza: T20I batting by series and tournaments Mat Inns NO Runs HS Avg BF SR 100 50 0 4s 6s ICC Men's T20 World Cup 14 14 2 425 82 35.41 273 155.67 0 2 2 33 24 Bangladesh tour of Zimbabwe 9 9 1 182 65* 22.75 122 149.18 0 2 3 16 8 India tour of Zimbabwe 8 8 0 94 46 11.75 90 104.44 0 0 2 8 4 Namibia tour of Zimbabwe 7 7 1 109 37 18.16 100 109.00 0 0 0 6 4 Zimbabwe tour of Bangladesh 7 7 1 115 72* 19.16 94 122.34 0 1 1 14 4 ICC Men's T20 World Cup Africa Region Final 5 5 0 74 24 14.80 54 137.03 0 0 1 4 4 ICC Men's T20 World Cup Africa Region Qualifier 5 5 0 273 82 54.60 181 150.82 0 3 0 13 24 ICC Men's T20 World Cup Qualifier 5 5 1 228 87 57.00 129 176.74 0 2 0 18 12 Namibia T20I Tri-Series 5 5 0 100 45 20.00 93 107.52 0 0 1 7 3 Zimbabwe tour of Namibia 5 5 1 177 82* 44.25 120 147.50 0 2 0 11 13 ICC Men's T20 World Cup Sub Regional Africa Qualifier 4 4 2 199 133* 99.50 89 223.59 1 0 0 14 18 India in Zimbabwe T20I Series 4 4 0 39 20 9.75 44 88.63 0 0 0 3 0 All 147 142 13 3,369 133* 26.11 2,468 136.50 2 17 12 258 161
Sikandar Raza: T20I bowling by series and tournaments Mat Inns Balls Mdns Runs Wkts BBI Avg Econ SR 4w 5w ICC Men's T20 World Cup 14 14 264 0 336 15 3/19 22.40 7.63 17.60 0 0 Bangladesh tour of Zimbabwe 9 9 168 0 211 5 2/38 42.20 7.53 33.60 0 0 India tour of Zimbabwe 8 8 168 0 245 7 3/25 35.00 8.75 24.00 0 0 Namibia tour of Zimbabwe 8 8 168 0 180 12 3/16 15.00 6.42 14.00 0 0 Zimbabwe tour of Bangladesh 7 7 156 0 199 3 1/24 66.33 7.65 52.00 0 0 ICC Men's T20 World Cup Africa Region Qualifier 6 6 107 1 84 10 3/3 8.40 4.71 10.70 0 0 ICC Men's T20 World Cup Africa Region Final 5 5 102 2 90 4 2/6 22.50 5.29 25.50 0 0 Namibia T20I Tri-Series 5 5 114 0 151 3 1/27 50.33 7.94 38.00 0 0 Zimbabwe tour of Namibia 5 5 100 0 141 4 4/24 35.25 8.46 25.00 1 0 ICC Men's T20 World Cup Qualifier 4 4 66 1 71 5 4/8 14.20 6.45 13.20 1 0 ICC Men's T20 World Cup Sub Regional Africa Qualifier 4 4 84 1 59 10 5/18 5.90 4.21 8.40 0 1 India in Zimbabwe T20I Series 4 4 42 0 38 0 0/2 N/A 5.42 N/A 0 0 All 147 132 2,496 5 2,948 116 5/18 25.41 7.08 21.51 2 1
Sikandar Raza: T20I batting by batting first or chasing Mat Inns NO Runs HS Avg BF SR 100 50 0 4s 6s Batting first 78 78 8 1,924 133* 27.48 1,372 140.23 1 11 7 146 96 Chasing 64 64 5 1,445 106* 24.49 1,096 131.84 1 6 5 112 65 All 147 142 13 3,369 133* 26.11 2,468 136.50 2 17 12 258 161
Sikandar Raza: T20I bowling by bowling first or defending Mat Inns Balls Mdns Runs Wkts BBI Avg Econ SR 4w 5w Bowling first 63 63 1,320 1 1,595 63 4/24 25.31 7.25 20.95 1 0 Defending a total 69 69 1,176 4 1,353 53 5/18 25.52 6.90 22.18 1 1 All 147 132 2,496 5 2,948 116 5/18 25.41 7.08 21.51 2 1
- not recorded in the scorecards · N/A no dismissals or balls to divide by
Best T20I performances Sikandar Raza: highest T20I scores Score BF SR 4s 6s Opponent Ground Date 133* 43 309.30 7 15 Gambia Ruaraka Sports Club Ground 2024-10-23 106* 56 189.28 5 9 Afghanistan Sharjah Cricket Stadium 2026-10-29 87 40 217.50 8 5 Singapore Queens Sports Club 2022-07-11 82* 40 205.00 7 5 United States of America Queens Sports Club 2022-07-14 82* 35 234.28 3 9 Namibia Wanderers Cricket Ground 2023-10-25 82 48 170.83 5 5 Ireland Bellerive Oval 2022-10-17 82 48 170.83 1 8 Kenya United Cricket Club Ground 2023-11-30 73 43 169.76 8 4 South Africa Arun Jaitley Stadium 2026-03-01 72* 46 156.52 6 4 Bangladesh Shere Bangla National Stadium 2024-05-12 65* 26 250.00 7 4 Bangladesh Harare Sports Club 2022-07-30
Sikandar Raza: best T20I bowling Figures Balls Mdns Econ Opponent Ground Date 5/18 24 1 4.50 Rwanda Ruaraka Sports Club Ground 2024-10-22 4/8 24 1 2.00 Netherlands Queens Sports Club 2022-07-17 4/24 24 0 6.00 Namibia United Cricket Club Ground 2023-10-30 3/3 16 0 1.12 Rwanda Wanderers Cricket Ground 2023-11-27 3/10 24 0 2.50 Tanzania United Cricket Club Ground 2023-11-23 3/11 24 0 2.75 Sri Lanka Harare Sports Club 2025-09-06 3/13 24 0 3.25 Sri Lanka R Premadasa Stadium 2024-01-14 3/16 24 0 4.00 Namibia Queens Sports Club 2022-05-21 3/17 24 0 4.25 Kenya Gymkhana Club Ground 2024-10-24 3/19 24 0 4.75 West Indies Bellerive Oval 2022-10-19
Latest T20I matches Latest T20I matches Date Opponent Bat Bowl Ground Result 2026-11-01 Afghanistan 2 - Sharjah Cricket Stadium Afghanistan won by 7 wickets 2026-10-29 Afghanistan 106* 1/53 Sharjah Cricket Stadium Afghanistan won by 19 runs 2026-10-27 Afghanistan 17 1/33 Sharjah Cricket Stadium Afghanistan won by 37 runs 2026-09-06 South Africa 16 1/30 Namibia Cricket Ground South Africa won by 48 runs 2026-09-03 Namibia 29 1/27 Namibia Cricket Ground Zimbabwe won by 5 wickets 2026-09-01 South Africa 45 0/36 Namibia Cricket Ground South Africa won by 43 runs 2026-08-31 Namibia 0 1/31 Namibia Cricket Ground Zimbabwe won by 5 runs 2026-08-29 South Africa 10 0/27 Namibia Cricket Ground South Africa won by 7 wickets 2026-07-26 India 0 1/40 Harare Sports Club India won by 35 runs 2026-07-25 India 0 0/47 Harare Sports Club India won by 90 runs
182 Runs
133.82 Strike rate
26.00 Average
0 Hundreds
1 Fifties
57 Highest
Punjab Kings 2023 to 2024 · 9 matches
IPL career record IPL batting record Batting Mat Inns NO Runs HS Avg BF SR 100 50 0 4s 6s Career 9 9 2 182 57 26.00 136 133.82 0 1 0 12 8
IPL fielding and awards Other Ct St PoM Career 5 0 1
IPL career in charts IPL runs by season 0 40 80 120 2023: 139 runs 139 2023 2024: 43 runs 43 2024
IPL season by season IPL record by season Season Team Mat Runs HS Avg SR 50+ 2024 Punjab Kings 2 43 28 21.50 113.15 0 2023 Punjab Kings 7 139 57 27.80 141.83 1 Career 9 182 57 26.00 133.82 1
Ball-by-ball IPL analysis Phase splits, bowler and batter matchups, dismissal patterns and every innings for Sikandar Raza in the IPL analytics.
Open IPL analysis Make IPL stat card IPL records
Source: Cricsheet ball-by-ball data (licensed under ODC-BY 1.0 ), 1,243 matches to 2026-05-31. Balls faced exclude wides. Bowlers are charged wides and no-balls. Super overs are excluded.
484 Runs
143.62 Strike rate
26.88 Average
0 Hundreds
2 Fifties
82 Highest
Zimbabwe 2014 to 2026 · 20 matches
T20 World Cup career record T20 World Cup batting record Batting Mat Inns NO Runs HS Avg BF SR 100 50 0 4s 6s Career 20 20 2 484 82 26.88 337 143.62 0 2 2 39 24
T20 World Cup bowling record Bowling Mat Inns Overs Runs Wkts BBI Avg Econ SR Dot % 4w 5w Career 20 18 53.0 395 18 3/19 21.94 7.45 17.66 29.55 0 0
T20 World Cup fielding and awards Other Ct St PoM Career 7 0 5
T20 World Cup career in charts T20 World Cup runs by season 0 60 120 180 2014: 32 runs 32 2014 2016: 27 runs 27 2016 2021 2022: 219 runs 219 2022 2024 2026: 206 runs 206 2026 T20 World Cup wickets by season 0 3 6 9 2014: 2 wickets 2 2014 2016: 1 wicket 1 2016 2021 2022: 10 wickets 10 2022 2024 2026: 5 wickets 5 2026
T20 World Cup season by season T20 World Cup record by season Season Team Mat Runs HS Avg SR 50+ Wkts BBI Econ 2026 Zimbabwe 6 206 73 51.50 164.80 1 5 3/29 9.00 2022 Zimbabwe 8 219 82 27.37 147.97 1 10 3/19 6.50 2016 Zimbabwe 3 27 15 9.00 90.00 0 1 1/10 7.33 2014 Zimbabwe 3 32 13 10.66 94.11 0 2 2/15 5.00 Career 20 484 82 26.88 143.62 2 18 3/19 7.45
Ball-by-ball T20 World Cup analysis Phase splits, bowler and batter matchups, dismissal patterns and every innings for Sikandar Raza in the T20 World Cup analytics.
Open T20 World Cup analysis Make T20 World Cup stat card T20 World Cup records
Source: Cricsheet ball-by-ball data (licensed under ODC-BY 1.0 ), 378 matches to 2026-03-08. Balls faced exclude wides. Bowlers are charged wides and no-balls. Super overs are excluded. T20 World Cup matches are T20Is, so they are also counted in the T20I record.
Questions about Sikandar Raza How many Test runs has Sikandar Raza scored? Sikandar Raza has 1,434 runs in 42 Test innings from 22 matches at an average of 34.14 and a strike rate of 56.12. Highest score: 127. Full answer →
What is Sikandar Raza's Test batting average? Sikandar Raza's Test batting average is 34.14, from 1,434 runs and 42 innings. Full answer →
How many Test wickets has Sikandar Raza taken? Sikandar Raza has taken 40 wickets in Test from 22 matches at a bowling average of 44.55. Best innings: 7/113. Full answer →
How many ODI runs has Sikandar Raza scored? Sikandar Raza has 4,824 runs in 153 ODI innings from 162 matches at an average of 37.39 and a strike rate of 85.51. Highest score: 141. Full answer →
What is Sikandar Raza's ODI batting average? Sikandar Raza's ODI batting average is 37.39, from 4,824 runs and 153 innings. Full answer →
How many ODI wickets has Sikandar Raza taken? Sikandar Raza has taken 101 wickets in ODI from 162 matches at a bowling average of 44.00. Best innings: 4/55. Full answer →
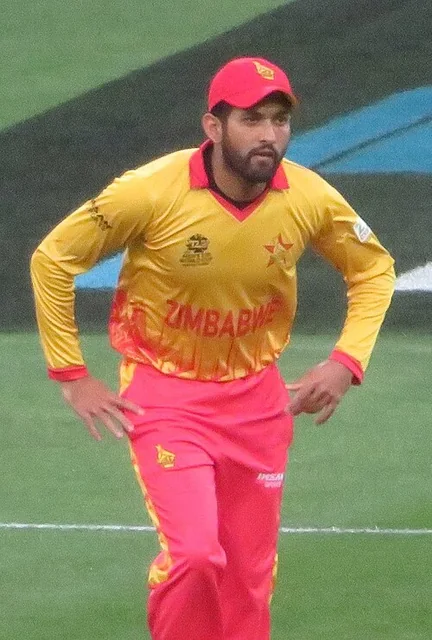

 ZimbabweMenMiddle-order batter2013 to 2026