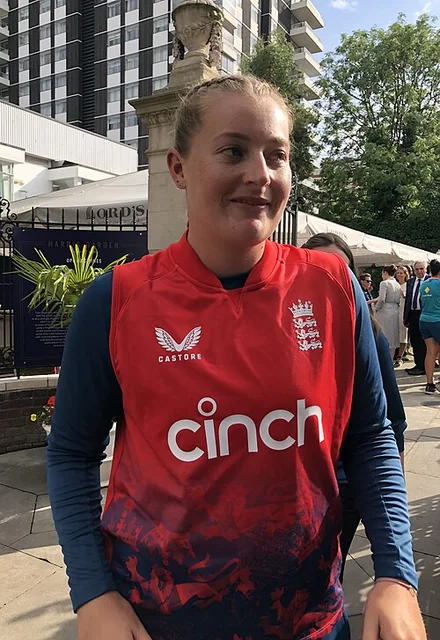
Home / Players / Sophie Ecclestone Overview Test10 ODI84 T20I113 Recent scores Oldest on the left. Recorded scorecards only. The top edge marks the result for their side.
Last 12 bowling innings 19 Wickets
5/118 Best
4.69 Economy
Last 12 batting innings 131 Runs
18.71 Average
86.18 Strike rate
Career records by format Batting career records by format Format Mat Inns NO Runs HS Avg BF SR 100s 50s 0s 4s 6s Test 10 16 3 257 50 19.76 552 46.55 0 1 1 30 1 ODI 84 56 16 426 33* 10.65 598 71.23 0 0 7 36 6 T20I 113 47 26 368 35 17.52 277 132.85 0 0 1 29 16
Bowling career records by format Format Mat Inns Balls Mdns Runs Wkts BBI BBM Avg Econ SR 4w 5w 10w Test 10 18 2,841 102 1,376 48 5/63 10/192 28.66 2.90 59.18 2 4 1 ODI 84 82 4,399 86 2,732 141 6/36 6/36 19.37 3.72 31.19 5 2 - T20I 113 112 2,517 10 2,532 154 4/18 4/18 16.44 6.03 16.34 2 0 -
Fielding career records by format Format Mat Inns Ct St Dis Dis/inns Best Test 10 18 7 0 7 0.388 1 (1ct 0st) ODI 84 83 23 0 23 0.277 2 (2ct 0st) T20I 113 112 38 0 38 0.339 2 (2ct 0st)
Runs by format
257 24% 426 41% 368 35%
Wickets by format
48 14% 141 41% 154 45%
Career records checked 2026-11-09. Independent of the scorecard archive.
England · Compare with another player
Innings explorer 206 scorecards Open explorer
Scorecard coverage Scorecard coverage of the official career Format Official bat inns In scorecards Official bowl inns In scorecards First Latest Coverage Test 16 16 18 18 2017-11-09 2026-07-10 Complete ODI 56 56 82 82 2016-10-08 2026-05-16 Complete T20I 47 47 112 112 2016-07-03 2026-07-05 Complete
257 Runs
19.76 Bat avg
46.55 Strike rate
48 Wickets 11th among women
28.66 Bowl avg
2.90 Economy
Recent scores Oldest on the left. Recorded scorecards only. The top edge marks the result for their side.
Last 12 batting innings 189 Runs
17.18 Average
55.42 Strike rate
Last 12 bowling innings 34 Wickets
5/63 Best
2.85 Economy
Official Test record Official Test batting record Batting Mat Inns NO Runs HS Avg BF SR 100 50 0 4s 6s Career 10 16 3 257 50 19.76 552 46.55 0 1 1 30 1
Official Test bowling record Bowling Mat Inns Balls Mdns Runs Wkts BBI BBM Avg Econ SR 4w 5w 10w Career 10 18 2,841 102 1,376 48 5/63 10/192 28.66 2.90 59.18 2 4 1
Official Test fielding record Fielding Mat Inns Ct St Dis Dis/Inns Best Career 10 18 7 0 7 0.388 1 (1ct 0st)
Test career in charts Test batting form: average over 10 innings 5 10 15 20 Overall 19.8 Best spell: 20.0 up to 2023-12-14 Best 20.0 Latest: 15.4 2023 2024 2025 2026 Test runs by year 0 20 40 60 2017: 8 runs 8 2017 2018: 0 runs 2019: 9 runs 9 2019 2020: 0 runs 2021: 17 runs 17 2021 2022: 69 runs 69 2023: 37 runs 37 2023 2024: 37 runs 37 2025: 19 runs 19 2025 2026: 61 runs 61 2026 Last 20 Test innings
0 1-49 50-99 100+ * not out
Test innings by score How Test innings ended Caught 4 · 25.0%
Bowled 4 · 25.0%
LBW 5 · 31.2%
Not out 3 · 18.8%
Test batting position: average and innings Test runs from boundaries Fours 120 · 46.7%
Sixes 6 · 2.3%
Other runs 131 · 51.0%
Test bowling form: wickets per innings over 10 innings 1 2 3 Overall 2.67 Best spell: 3.20 up to 2026-07-10 Best 3.20 Latest: 3.20 2023 2024 2025 2026 Test wickets by year 0 4 8 12 2017: 3 wickets 3 2017 2018: 0 wickets 2019: 3 wickets 3 2019 2020: 0 wickets 2021: 8 wickets 8 2021 2022: 3 wickets 3 2023: 15 wickets 15 2023 2024: 3 wickets 3 2025: 5 wickets 5 2025 2026: 8 wickets 8 2026 Last 20 Test bowling innings
Test innings by wickets
Test record by situation complete career Opposition Home and away Match innings Batting position Match result Year Series and tournaments Ground
Sophie Ecclestone: Test batting by opposition Mat Inns NO Runs HS Avg BF SR 100 50 0 4s 6s Australia 5 8 3 97 34 19.40 280 34.64 0 0 0 13 0 India 3 5 0 88 50 17.60 157 56.05 0 1 1 10 0 South Africa 2 3 0 72 35 24.00 115 62.60 0 0 0 7 1 All 10 16 3 257 50 19.76 552 46.55 0 1 1 30 1
Sophie Ecclestone: Test bowling by opposition Mat Inns Balls Mdns Runs Wkts BBI Avg Econ SR 4w 5w Australia 5 8 1,517 50 711 22 5/63 32.31 2.81 68.95 0 3 India 3 6 965 28 559 21 5/118 26.61 3.47 45.95 2 1 South Africa 2 4 358 24 106 5 2/7 21.20 1.77 71.60 0 0 All 10 18 2,840 102 1,376 48 5/63 28.66 2.90 59.16 2 4
Sophie Ecclestone: Test batting by home and away Mat Inns NO Runs HS Avg BF SR 100 50 0 4s 6s Home 5 7 1 149 50 24.83 294 50.68 0 1 0 19 0 Away 5 9 2 108 34 15.42 258 41.86 0 0 1 11 1 All 10 16 3 257 50 19.76 552 46.55 0 1 1 30 1
Sophie Ecclestone: Test bowling by home and away Mat Inns Balls Mdns Runs Wkts BBI Avg Econ SR 4w 5w Home 5 10 1,661 63 770 31 5/63 24.83 2.78 53.58 2 3 Away 5 8 1,179 39 606 17 5/143 35.64 3.08 69.35 0 1 All 10 18 2,840 102 1,376 48 5/63 28.66 2.90 59.16 2 4
Sophie Ecclestone: Test batting by match innings Mat Inns NO Runs HS Avg BF SR 100 50 0 4s 6s 1st innings of the match 4 4 1 47 21 15.66 110 42.72 0 0 0 5 0 2nd innings of the match 6 6 1 106 35 21.20 258 41.08 0 0 1 13 0 3rd innings of the match 2 2 0 34 18 17.00 73 46.57 0 0 0 2 1 4th innings of the match 4 4 1 70 50 23.33 111 63.06 0 1 0 10 0 All 10 16 3 257 50 19.76 552 46.55 0 1 1 30 1
Sophie Ecclestone: Test bowling by match innings Mat Inns Balls Mdns Runs Wkts BBI Avg Econ SR 4w 5w 1st innings of the match 6 6 1,002 34 485 14 5/129 34.64 2.90 71.57 0 1 2nd innings of the match 4 4 794 28 378 13 5/143 29.07 2.85 61.07 1 1 3rd innings of the match 7 7 1,016 37 506 19 5/63 26.63 2.98 53.47 1 2 4th innings of the match 1 1 28 3 7 2 2/7 3.50 1.50 14.00 0 0 All 10 18 2,840 102 1,376 48 5/63 28.66 2.90 59.16 2 4
Sophie Ecclestone: Test batting by batting position Mat Inns NO Runs HS Avg BF SR 100 50 0 4s 6s No. 7 1 2 0 10 10 5.00 13 76.92 0 0 1 2 0 No. 8 5 8 0 169 50 21.12 294 57.48 0 1 0 19 1 No. 9 2 2 0 27 17 13.50 89 30.33 0 0 0 3 0 No. 10 2 3 2 43 34 43.00 137 31.38 0 0 0 5 0 No. 11 1 1 1 8 8* N/A 19 42.10 0 0 0 1 0 All 10 16 3 257 50 19.76 552 46.55 0 1 1 30 1
Sophie Ecclestone: Test batting by match result Mat Inns NO Runs HS Avg BF SR 100 50 0 4s 6s Won 1 2 0 37 21 18.50 51 72.54 0 0 0 3 1 Lost 4 8 0 117 50 14.62 225 52.00 0 1 1 16 0 Drawn 5 6 3 103 35 34.33 276 37.31 0 0 0 11 0 All 10 16 3 257 50 19.76 552 46.55 0 1 1 30 1
Sophie Ecclestone: Test bowling by match result Mat Inns Balls Mdns Runs Wkts BBI Avg Econ SR 4w 5w Won 1 2 178 12 47 3 2/7 15.66 1.58 59.33 0 0 Lost 4 7 1,311 37 688 28 5/63 24.57 3.14 46.82 0 4 Drawn 5 9 1,351 53 641 17 4/88 37.70 2.84 79.47 2 0 All 10 18 2,840 102 1,376 48 5/63 28.66 2.90 59.16 2 4
Sophie Ecclestone: Test batting by year Mat Inns NO Runs HS Avg BF SR 100 50 0 4s 6s 2017 1 1 1 8 8* N/A 19 42.10 0 0 0 1 0 2019 1 1 1 9 9* N/A 19 47.36 0 0 0 2 0 2021 1 1 0 17 17 17.00 56 30.35 0 0 0 1 0 2022 2 3 1 69 35 34.50 182 37.91 0 0 0 7 0 2023 2 4 0 37 17 9.25 80 46.25 0 0 1 7 0 2024 1 2 0 37 21 18.50 51 72.54 0 0 0 3 1 2025 1 2 0 19 18 9.50 57 33.33 0 0 0 2 0 2026 1 2 0 61 50 30.50 88 69.31 0 1 0 7 0 All 10 16 3 257 50 19.76 552 46.55 0 1 1 30 1
Sophie Ecclestone: Test bowling by year Mat Inns Balls Mdns Runs Wkts BBI Avg Econ SR 4w 5w 2017 1 1 221 6 107 3 3/107 35.66 2.90 73.66 0 0 2019 1 2 302 14 127 3 2/90 42.33 2.52 100.66 0 0 2021 1 2 384 15 206 8 4/88 25.75 3.21 48.00 2 0 2022 2 4 444 18 201 3 1/26 67.00 2.71 148.00 0 0 2023 2 4 712 23 359 15 5/63 23.93 3.02 47.46 0 2 2024 1 2 178 12 47 3 2/7 15.66 1.58 59.33 0 0 2025 1 1 267 8 143 5 5/143 28.60 3.21 53.40 0 1 2026 1 2 332 6 186 8 5/118 23.25 3.36 41.50 0 1 All 10 18 2,840 102 1,376 48 5/63 28.66 2.90 59.16 2 4
Sophie Ecclestone: Test batting by series and tournaments Mat Inns NO Runs HS Avg BF SR 100 50 0 4s 6s Women's Ashes 4 7 2 88 34 17.60 261 33.71 0 0 0 11 0 India Women tour of England 2 3 0 78 50 26.00 144 54.16 0 1 0 8 0 All 10 16 3 257 50 19.76 552 46.55 0 1 1 30 1
Sophie Ecclestone: Test bowling by series and tournaments Mat Inns Balls Mdns Runs Wkts BBI Avg Econ SR 4w 5w Women's Ashes 4 6 1,215 36 584 19 5/63 30.73 2.88 63.94 0 3 India Women tour of England 2 4 716 21 392 16 5/118 24.50 3.28 44.75 2 1 All 10 18 2,840 102 1,376 48 5/63 28.66 2.90 59.16 2 4
Sophie Ecclestone: Test bowling by ground Mat Inns Balls Mdns Runs Wkts BBI Avg Econ SR 4w 5w The County Ground 2 4 482 26 186 5 2/90 37.20 2.31 96.40 0 0 All 10 18 2,840 102 1,376 48 5/63 28.66 2.90 59.16 2 4
- not recorded in the scorecards · N/A no dismissals or balls to divide by
Best Test performances Sophie Ecclestone: highest Test scores Score BF SR 4s 6s Opponent Ground Date 50 66 75.75 6 0 India Lord's 2026-07-10 35 64 54.68 4 0 South Africa The County Ground 2022-06-27 34 117 29.05 3 0 Australia Manuka Oval 2022-01-27 21 28 75.00 3 0 South Africa Mangaung Oval 2024-12-15 18 50 36.00 2 0 Australia Melbourne Cricket Ground 2025-01-30 17 56 30.35 1 0 India County Ground, Bristol 2021-06-16 17 34 50.00 3 0 Australia Trent Bridge 2023-06-22 16 23 69.56 0 1 South Africa Mangaung Oval 2024-12-15 11 22 50.00 1 0 India Lord's 2026-07-10 10 33 30.30 2 0 Australia Trent Bridge 2023-06-22
Sophie Ecclestone: best Test bowling Figures Balls Mdns Econ Opponent Ground Date 5/63 185 7 2.04 Australia Trent Bridge 2023-06-22 5/118 201 4 3.52 India Lord's 2026-07-10 5/129 278 9 2.78 Australia Trent Bridge 2023-06-22 5/143 267 8 3.21 Australia Melbourne Cricket Ground 2025-01-30 4/88 156 5 3.38 India County Ground, Bristol 2021-06-16 4/118 228 10 3.10 India County Ground, Bristol 2021-06-16 3/68 131 2 3.11 India Lord's 2026-07-10 3/91 159 5 3.43 India Dr DY Patil Sports Academy 2023-12-14 3/107 221 6 2.90 Australia North Sydney Oval 2017-11-09 2/7 28 3 1.50 South Africa Mangaung Oval 2024-12-15
Latest Test matches Latest Test matches Date Opponent Bat Bowl Ground Result 2026-07-10 India 11 & 50 3/68 & 5/118 Lord's India won by 270 runs 2025-01-30 Australia 1 & 18 5/143 Melbourne Cricket Ground Australia won by an innings and 122 runs 2024-12-15 South Africa 21 & 16 1/40 & 2/7 Mangaung Oval England won by 286 runs 2023-12-14 India 0 & 10 3/91 & 2/76 Dr DY Patil Sports Academy India won by 347 runs 2023-06-22 Australia 17 & 10 5/129 & 5/63 Trent Bridge Australia won by 89 runs 2022-06-27 South Africa 35 1/33 & 1/26 The County Ground Match drawn 2022-01-27 Australia 34 & 0* 0/74 & 1/68 Manuka Oval Match drawn 2021-06-16 India 17 4/88 & 4/118 County Ground, Bristol Match drawn 2019-07-18 Australia 9* 2/90 & 1/37 The County Ground Match drawn 2017-11-09 Australia 8* 3/107 North Sydney Oval Match drawn
141 Wickets 15th among women
19.37 Average
3.72 Economy
31.19 Strike rate
6/36 Best
2 Five-fors 11th among women
Recent scores Oldest on the left. Recorded scorecards only. The top edge marks the result for their side.
Last 12 bowling innings 22 Wickets
4/17 Best
4.35 Economy
Last 12 batting innings 85 Runs
9.44 Average
78.70 Strike rate
Official ODI record Official ODI batting record Batting Mat Inns NO Runs HS Avg BF SR 100 50 0 4s 6s Career 84 56 16 426 33* 10.65 598 71.23 0 0 7 36 6
Official ODI bowling record Bowling Mat Inns Balls Mdns Runs Wkts BBI BBM Avg Econ SR 4w 5w 10w Career 84 82 4,399 86 2,732 141 6/36 6/36 19.37 3.72 31.19 5 2 -
Official ODI fielding record Fielding Mat Inns Ct St Dis Dis/Inns Best Career 84 83 23 0 23 0.277 2 (2ct 0st)
ODI career in charts ODI bowling form: wickets per innings over 10 innings 1 2 Overall 1.72 Best spell: 2.50 up to 2025-01-14 Best 2.50 Latest: 2.00 2018 2021 2023 2025 ODI wickets by year 0 9 18 27 2016: 3 wickets 3 2016 2017: 2 wickets 2 2018: 18 wickets 18 2018 2019: 14 wickets 14 2020: 0 wickets 2020 2021: 16 wickets 16 2022: 34 wickets 34 2022 2023: 5 wickets 5 2024: 21 wickets 21 2024 2025: 28 wickets 28 2026: 0 wickets 2026 Last 20 ODI bowling innings
ODI innings by wickets ODI batting form: average over 10 innings 7 14 21 28 Overall 10.7 Best spell: 27.0 up to 2022-03-27 Best 27.0 Latest: 9.6 2019 2022 2024 2026 ODI runs by year 0 50 100 150 2016: 3 runs 3 2016 2017: 4 runs 4 2018: 16 runs 16 2018 2019: 53 runs 53 2020: 0 runs 2020 2021: 29 runs 29 2022: 198 runs 198 2022 2023: 16 runs 16 2024: 40 runs 40 2024 2025: 60 runs 60 2026: 7 runs 7 2026 Last 20 ODI innings
0 1-49 50-99 100+ * not out
ODI innings by score How ODI innings ended Caught 22 · 39.3%
Bowled 7 · 12.5%
LBW 8 · 14.3%
Run out 2 · 3.6%
Stumped 1 · 1.8%
Not out 16 · 28.6%
ODI batting position: average and innings ODI runs from boundaries Fours 144 · 33.8%
Sixes 36 · 8.5%
Other runs 246 · 57.7%
ODI record by situation complete career Opposition Home and away Batting first or chasing Batting position Match result Year Ground Series and tournaments Bowling first or defending
Sophie Ecclestone: ODI batting by opposition Mat Inns NO Runs HS Avg BF SR 100 50 0 4s 6s Australia 17 17 4 120 32* 9.23 199 60.30 0 0 2 11 2 India 12 12 3 81 31 9.00 105 77.14 0 0 2 10 0 New Zealand 11 11 2 50 14 5.55 90 55.55 0 0 2 4 1 West Indies 8 8 4 84 33* 21.00 105 80.00 0 0 1 3 2 South Africa 5 5 2 70 24 23.33 79 88.60 0 0 0 8 0 Bangladesh 1 1 1 17 17* N/A 11 154.54 0 0 0 0 1 Pakistan 1 1 0 1 1 1.00 5 20.00 0 0 0 0 0 Sri Lanka 1 1 0 3 3 3.00 4 75.00 0 0 0 0 0 All 84 56 16 426 33* 10.65 598 71.23 0 0 7 36 6
Sophie Ecclestone: ODI bowling by opposition Mat Inns Balls Mdns Runs Wkts BBI Avg Econ SR 4w 5w New Zealand 19 19 982 17 603 28 5/25 21.53 3.68 35.07 0 1 Australia 17 17 965 7 769 22 4/35 34.95 4.78 43.86 1 0 India 16 16 892 19 557 28 4/14 19.89 3.74 31.85 2 0 South Africa 12 12 663 10 383 25 6/36 15.32 3.46 26.52 1 1 West Indies 9 9 438 19 195 16 3/9 12.18 2.67 27.37 0 0 Pakistan 6 6 279 4 169 12 3/15 14.08 3.63 23.25 0 0 Bangladesh 2 2 120 7 39 6 3/15 6.50 1.95 20.00 0 0 Sri Lanka 1 1 60 3 17 4 4/17 4.25 1.70 15.00 1 0 All 84 82 4,399 86 2,732 141 6/36 19.37 3.72 31.19 5 2
Sophie Ecclestone: ODI batting by home and away Mat Inns NO Runs HS Avg BF SR 100 50 0 4s 6s Home 23 23 7 167 31 10.43 208 80.28 0 0 3 16 3 Away 24 24 4 149 32* 7.45 276 53.98 0 0 4 10 2 Neutral 9 9 5 110 33* 27.50 114 96.49 0 0 0 10 1 All 84 56 16 426 33* 10.65 598 71.23 0 0 7 36 6
Sophie Ecclestone: ODI bowling by home and away Mat Inns Balls Mdns Runs Wkts BBI Avg Econ SR 4w 5w Home 36 36 1,927 29 1,231 62 5/25 19.85 3.83 31.08 0 1 Away 30 30 1,659 39 951 47 4/14 20.23 3.43 35.29 4 0 Neutral 16 16 813 18 550 32 6/36 17.18 4.05 25.40 1 1 All 84 82 4,399 86 2,732 141 6/36 19.37 3.72 31.19 5 2
Sophie Ecclestone: ODI batting by batting first or chasing Mat Inns NO Runs HS Avg BF SR 100 50 0 4s 6s Batting first 37 37 13 366 32* 15.25 460 79.56 0 0 1 33 6 Chasing 19 19 3 60 33* 3.75 138 43.47 0 0 6 3 0 All 84 56 16 426 33* 10.65 598 71.23 0 0 7 36 6
Sophie Ecclestone: ODI bowling by bowling first or defending Mat Inns Balls Mdns Runs Wkts BBI Avg Econ SR 4w 5w Bowling first 37 37 2,012 38 1,317 71 5/25 18.54 3.92 28.33 3 1 Defending a total 45 45 2,387 48 1,415 70 6/36 20.21 3.55 34.10 2 1 All 84 82 4,399 86 2,732 141 6/36 19.37 3.72 31.19 5 2
Sophie Ecclestone: ODI batting by batting position Mat Inns NO Runs HS Avg BF SR 100 50 0 4s 6s No. 7 3 3 1 25 23* 12.50 29 86.20 0 0 1 3 0 No. 8 18 18 4 147 31 10.50 183 80.32 0 0 1 12 2 No. 9 21 21 7 193 33* 13.78 283 68.19 0 0 1 14 3 No. 10 11 11 2 43 27 4.77 85 50.58 0 0 3 6 0 No. 11 3 3 2 18 12* 18.00 18 100.00 0 0 1 1 1 All 84 56 16 426 33* 10.65 598 71.23 0 0 7 36 6
Sophie Ecclestone: ODI batting by match result Mat Inns NO Runs HS Avg BF SR 100 50 0 4s 6s Won 21 21 8 143 24 11.00 162 88.27 0 0 2 8 5 Lost 35 35 8 283 33* 10.48 436 64.90 0 0 5 28 1 All 84 56 16 426 33* 10.65 598 71.23 0 0 7 36 6
Sophie Ecclestone: ODI bowling by match result Mat Inns Balls Mdns Runs Wkts BBI Avg Econ SR 4w 5w Won 46 46 2,356 59 1,339 95 6/36 14.09 3.41 24.80 2 2 Lost 35 35 1,995 27 1,358 45 4/35 30.17 4.08 44.33 3 0 No result 1 1 48 0 35 1 1/35 35.00 4.37 48.00 0 0 All 84 82 4,399 86 2,732 141 6/36 19.37 3.72 31.19 5 2
Sophie Ecclestone: ODI batting by year Mat Inns NO Runs HS Avg BF SR 100 50 0 4s 6s 2016 2 2 0 3 3 1.50 13 23.07 0 0 1 0 0 2017 2 2 1 4 3 4.00 9 44.44 0 0 0 0 0 2018 5 5 2 16 12* 5.33 30 53.33 0 0 1 1 0 2019 7 7 2 53 27 10.60 65 81.53 0 0 2 6 2 2021 6 6 1 29 9 5.80 51 56.86 0 0 0 2 0 2022 17 17 6 198 33* 18.00 263 75.28 0 0 2 15 2 2023 3 3 1 16 10* 8.00 24 66.66 0 0 0 0 1 2024 4 4 0 40 17 10.00 67 59.70 0 0 0 4 1 2025 9 9 2 60 23* 8.57 72 83.33 0 0 1 7 0 2026 1 1 1 7 7* N/A 4 175.00 0 0 0 1 0 All 84 56 16 426 33* 10.65 598 71.23 0 0 7 36 6
Sophie Ecclestone: ODI bowling by year Mat Inns Balls Mdns Runs Wkts BBI Avg Econ SR 4w 5w 2016 2 2 84 3 48 3 2/28 16.00 3.42 28.00 0 0 2017 2 2 90 0 87 2 1/38 43.50 5.80 45.00 0 0 2018 9 9 510 12 281 18 4/14 15.61 3.30 28.33 2 0 2019 11 11 565 6 376 14 3/30 26.85 3.99 40.35 0 0 2021 11 11 642 10 407 16 3/33 25.43 3.80 40.12 0 0 2022 20 20 1,123 29 651 34 6/36 19.14 3.47 33.02 0 1 2023 3 3 162 0 119 5 3/40 23.80 4.40 32.40 0 0 2024 10 10 520 11 267 21 5/25 12.71 3.08 24.76 0 1 2025 13 13 673 15 466 28 4/17 16.64 4.15 24.03 3 0 2026 1 1 30 0 30 0 0/30 N/A 6.00 N/A 0 0 All 84 82 4,399 86 2,732 141 6/36 19.37 3.72 31.19 5 2
Sophie Ecclestone: ODI batting by ground Mat Inns NO Runs HS Avg BF SR 100 50 0 4s 6s Grace Road 5 5 1 46 27 11.50 57 80.70 0 0 0 6 1 The County Ground 5 5 2 42 31 14.00 44 95.45 0 0 1 4 1 New Road, Worcester 4 4 2 36 12* 18.00 41 87.80 0 0 0 2 1 Junction Oval 3 3 1 34 32* 17.00 73 46.57 0 0 1 2 1 Seddon Park 3 3 0 23 14 7.66 38 60.52 0 0 0 2 1 Sir Vivian Richards Stadium 3 3 1 31 19* 15.50 44 70.45 0 0 0 1 0 All 84 56 16 426 33* 10.65 598 71.23 0 0 7 36 6
Sophie Ecclestone: ODI bowling by ground Mat Inns Balls Mdns Runs Wkts BBI Avg Econ SR 4w 5w The County Ground 9 9 457 6 275 18 3/14 15.27 3.61 25.38 0 0 Grace Road 5 5 296 4 190 9 3/30 21.11 3.85 32.88 0 0 New Road, Worcester 5 5 264 6 144 8 5/25 18.00 3.27 33.00 0 1 County Ground, Bristol 4 4 234 3 174 8 3/40 21.75 4.46 29.25 0 0 Hagley Oval 4 4 219 2 161 12 6/36 13.41 4.41 18.25 0 1 St Lawrence Ground 4 4 228 2 171 5 2/31 34.20 4.50 45.60 0 0 Barsapara Cricket Stadium 3 3 156 6 87 9 4/44 9.66 3.34 17.33 1 0 Junction Oval 3 3 180 5 73 5 4/35 14.60 2.43 36.00 1 0 Kinrara Academy Oval 3 3 143 1 110 3 2/39 36.66 4.61 47.66 0 0 Seddon Park 3 3 174 3 129 2 1/25 64.50 4.44 87.00 0 0 Sir Vivian Richards Stadium 3 3 150 10 49 5 3/9 9.80 1.96 30.00 0 0 University Oval, Dunedin 3 3 180 5 98 3 3/20 32.66 3.26 60.00 0 0 Vidarbha Cricket Association Stadium 3 3 174 7 83 8 4/14 10.37 2.86 21.75 2 0 All 84 82 4,399 86 2,732 141 6/36 19.37 3.72 31.19 5 2
Sophie Ecclestone: ODI batting by series and tournaments Mat Inns NO Runs HS Avg BF SR 100 50 0 4s 6s ICC Women's World Cup 12 12 5 116 33* 16.57 126 92.06 0 0 1 10 1 Women's Ashes 9 9 2 71 32* 10.14 127 55.90 0 0 1 4 2 ICC Women's Championship 6 6 3 33 12* 11.00 37 89.18 0 0 1 1 2 India Women tour of England 6 6 1 65 31 13.00 73 89.04 0 0 1 8 0 New Zealand Women tour of England 5 5 2 24 8 8.00 34 70.58 0 0 0 2 0 Australia Women tour of England 3 3 0 31 27 10.33 43 72.09 0 0 1 5 0 England Women tour of India 3 3 1 7 5 3.50 18 38.88 0 0 1 1 0 England Women tour of New Zealand 3 3 0 25 14 8.33 45 55.55 0 0 0 2 1 England Women tour of West Indies 3 3 1 31 19* 15.50 44 70.45 0 0 0 1 0 All 84 56 16 426 33* 10.65 598 71.23 0 0 7 36 6
Sophie Ecclestone: ODI bowling by series and tournaments Mat Inns Balls Mdns Runs Wkts BBI Avg Econ SR 4w 5w ICC Women's World Cup 16 16 850 21 556 37 6/36 15.02 3.92 22.97 2 1 ICC Women's Championship 10 10 540 7 325 16 3/14 20.31 3.61 33.75 0 0 India Women tour of England 9 9 502 9 331 16 3/27 20.68 3.95 31.37 0 0 Women's Ashes 9 9 522 6 342 14 4/35 24.42 3.93 37.28 1 0 New Zealand Women tour of England 8 8 408 7 267 13 5/25 20.53 3.92 31.38 0 1 England Women tour of New Zealand 6 6 354 5 205 5 2/36 41.00 3.47 70.80 0 0 England Women tour of India 4 4 216 7 104 6 4/14 17.33 2.88 36.00 1 0 Australia Women tour of England 3 3 176 1 130 4 3/34 32.50 4.43 44.00 0 0 England Women ODI tour of Malaysia 3 3 143 1 110 3 2/39 36.66 4.61 47.66 0 0 England Women tour of South Africa 3 3 165 2 82 5 3/27 16.40 2.98 33.00 0 0 England Women tour of West Indies 3 3 150 10 49 5 3/9 9.80 1.96 30.00 0 0 All 84 82 4,399 86 2,732 141 6/36 19.37 3.72 31.19 5 2
Sophie Ecclestone: ODI batting by batting first or chasing Mat Inns NO Runs HS Avg BF SR 100 50 0 4s 6s Batting first 37 37 13 366 32* 15.25 460 79.56 0 0 1 33 6 Chasing 19 19 3 60 33* 3.75 138 43.47 0 0 6 3 0 All 84 56 16 426 33* 10.65 598 71.23 0 0 7 36 6
Sophie Ecclestone: ODI bowling by bowling first or defending Mat Inns Balls Mdns Runs Wkts BBI Avg Econ SR 4w 5w Bowling first 37 37 2,012 38 1,317 71 5/25 18.54 3.92 28.33 3 1 Defending a total 45 45 2,387 48 1,415 70 6/36 20.21 3.55 34.10 2 1 All 84 82 4,399 86 2,732 141 6/36 19.37 3.72 31.19 5 2
- not recorded in the scorecards · N/A no dismissals or balls to divide by
Best ODI performances Sophie Ecclestone: highest ODI scores Score BF SR 4s 6s Opponent Ground Date 33* 41 80.48 2 0 West Indies University Oval, Dunedin 2022-03-09 32* 65 49.23 2 1 Australia Junction Oval 2022-02-06 31 33 93.93 4 0 India The County Ground 2022-09-18 27 27 100.00 5 0 Australia Grace Road 2019-07-02 24 11 218.18 5 0 South Africa Hagley Oval 2022-03-31 23* 19 121.05 3 0 India The Rose Bowl 2025-07-16 19* 21 90.47 1 0 West Indies Sir Vivian Richards Stadium 2022-12-04 17* 11 154.54 0 1 Bangladesh Basin Reserve 2022-03-27 17 27 62.96 2 0 South Africa Diamond Oval 2024-12-04 16 17 94.11 2 0 Australia North Sydney Oval 2025-01-12
Sophie Ecclestone: best ODI bowling Figures Balls Mdns Econ Opponent Ground Date 6/36 48 0 4.50 South Africa Hagley Oval 2022-03-31 5/25 54 3 2.77 New Zealand New Road, Worcester 2024-06-30 4/14 60 5 1.40 India Vidarbha Cricket Association Stadium 2018-04-09 4/17 60 3 1.70 Sri Lanka R Premadasa Stadium 2025-10-11 4/35 60 2 3.50 Australia Junction Oval 2025-01-14 4/37 60 2 3.70 India Vidarbha Cricket Association Stadium 2018-04-06 4/44 60 1 4.40 South Africa Barsapara Cricket Stadium 2025-10-29 3/9 54 6 1.00 West Indies Sir Vivian Richards Stadium 2022-12-09 3/14 48 2 1.75 New Zealand The County Ground 2018-07-10 3/15 60 4 1.50 Bangladesh Basin Reserve 2022-03-27
Latest ODI matches Latest ODI matches Date Opponent Bat Bowl Ground Result 2026-05-16 New Zealand 7* 0/30 Sophia Gardens New Zealand won by 17 runs (D/L method) 2025-10-29 South Africa 2 4/44 Barsapara Cricket Stadium South Africa won by 125 runs 2025-10-26 New Zealand did not bat 1/4 Andhra Cricket Association-Visakhapatnam District Cricket Association Stadium England won by 8 wickets 2025-10-22 Australia 10* 1/62 Holkar Cricket Stadium Australia won by 6 wickets 2025-10-19 India 3 1/58 Holkar Cricket Stadium England won by 4 runs 2025-10-11 Sri Lanka 3 4/17 R Premadasa Stadium England won by 89 runs 2025-10-07 Bangladesh did not bat 3/24 Barsapara Cricket Stadium England won by 4 wickets 2025-10-03 South Africa did not bat 2/19 Barsapara Cricket Stadium England won by 10 wickets 2025-07-22 India 1 1/28 Riverside Ground India won by 13 runs 2025-07-19 India did not bat 3/27 Lord's England won by 8 wickets (D/L method)
154 Wickets 6th among women
16.44 Average
6.03 Economy
16.34 Strike rate
4/18 Best
0 Five-fors
Recent scores Oldest on the left. Recorded scorecards only. The top edge marks the result for their side.
Last 12 bowling innings 12 Wickets
3/22 Best
6.59 Economy
Last 12 batting innings 116 Runs
16.57 Average
150.64 Strike rate
Official T20I record Official T20I batting record Batting Mat Inns NO Runs HS Avg BF SR 100 50 0 4s 6s Career 113 47 26 368 35 17.52 277 132.85 0 0 1 29 16
Official T20I bowling record Bowling Mat Inns Balls Mdns Runs Wkts BBI BBM Avg Econ SR 4w 5w 10w Career 113 112 2,517 10 2,532 154 4/18 4/18 16.44 6.03 16.34 2 0 -
Official T20I fielding record Fielding Mat Inns Ct St Dis Dis/Inns Best Career 113 112 38 0 38 0.339 2 (2ct 0st)
T20I career in charts T20I bowling form: wickets per innings over 10 innings 1 2 Overall 1.38 Best spell: 2.10 up to 2023-12-09 Best 2.10 Latest: 1.10 2018 2020 2022 2024 2026 T20I wickets by year 0 6 12 18 24 2016: 3 wickets 3 2016 2017: 4 wickets 4 2018: 17 wickets 17 2018 2019: 13 wickets 13 2020: 19 wickets 19 2020 2021: 11 wickets 11 2022: 19 wickets 19 2022 2023: 23 wickets 23 2024: 24 wickets 24 2024 2025: 9 wickets 9 2026: 12 wickets 12 2026 Last 20 T20I bowling innings
T20I innings by wickets T20I batting form: average over 10 innings 20 40 60 Overall 17.5 Best spell: 42.5 up to 2022-08-06 Best 42.5 Latest: 16.8 2020 2022 2024 2026 T20I runs by year 0 30 60 2017: 6 runs 6 2017 2018: 20 runs 20 2019: 19 runs 19 2019 2020: 20 runs 20 2021: 28 runs 28 2021 2022: 72 runs 72 2023: 45 runs 45 2023 2024: 57 runs 57 2025: 84 runs 84 2025 2026: 17 runs 17 2026 Last 20 T20I innings
0 1-49 50-99 100+ * not out
T20I innings by score How T20I innings ended Caught 10 · 21.3%
Bowled 3 · 6.4%
Run out 4 · 8.5%
Stumped 2 · 4.3%
Caught and bowled 2 · 4.3%
Not out 26 · 55.3%
T20I batting position: average and innings T20I runs from boundaries Fours 116 · 31.5%
Sixes 96 · 26.1%
Other runs 156 · 42.4%
T20I record by situation complete career Opposition Home and away Batting first or chasing Batting position Match result Year Ground Series and tournaments Bowling first or defending
Sophie Ecclestone: T20I batting by opposition Mat Inns NO Runs HS Avg BF SR 100 50 0 4s 6s India 13 13 8 129 35 25.80 93 138.70 0 0 0 9 6 Australia 10 10 1 76 22 8.44 68 111.76 0 0 1 4 4 West Indies 7 7 5 35 9* 17.50 29 120.68 0 0 0 4 1 New Zealand 6 6 3 55 18 18.33 50 110.00 0 0 0 4 2 Pakistan 4 4 3 30 19* 30.00 19 157.89 0 0 0 4 0 South Africa 4 4 3 35 33* 35.00 16 218.75 0 0 0 4 2 Bangladesh 1 1 1 8 8* N/A 2 400.00 0 0 0 0 1 Ireland 1 1 1 0 0* N/A 0 N/A 0 0 0 0 0 Sri Lanka 1 1 1 0 0* N/A 0 N/A 0 0 0 0 0 All 113 47 26 368 35 17.52 277 132.85 0 0 1 29 16
Sophie Ecclestone: T20I bowling by opposition Mat Inns Balls Mdns Runs Wkts BBI Avg Econ SR 4w 5w India 23 23 497 2 584 26 3/15 22.46 7.05 19.11 0 0 New Zealand 21 21 461 2 463 29 4/18 15.96 6.02 15.89 2 0 Australia 20 20 461 1 544 26 3/22 20.92 7.08 17.73 0 0 West Indies 15 15 331 3 284 20 3/7 14.20 5.14 16.55 0 0 South Africa 14 14 336 0 330 19 3/22 17.36 5.89 17.68 0 0 Pakistan 10 10 215 1 155 17 3/11 9.11 4.32 12.64 0 0 Bangladesh 2 2 48 0 41 1 1/20 41.00 5.12 48.00 0 0 Ireland 2 2 48 1 35 6 3/13 5.83 4.37 8.00 0 0 Scotland 2 2 48 0 36 4 2/13 9.00 4.50 12.00 0 0 Sri Lanka 2 2 48 0 52 5 3/25 10.40 6.50 9.60 0 0 Thailand 1 1 24 0 11 1 1/11 11.00 2.75 24.00 0 0 All 113 112 2,517 10 2,535 154 4/18 16.46 6.04 16.34 2 0
Sophie Ecclestone: T20I batting by home and away Mat Inns NO Runs HS Avg BF SR 100 50 0 4s 6s Home 28 28 18 276 35 27.60 183 150.81 0 0 1 26 11 Away 10 10 3 52 13 7.42 57 91.22 0 0 0 3 2 Neutral 9 9 5 40 11* 10.00 37 108.10 0 0 0 0 3 All 113 47 26 368 35 17.52 277 132.85 0 0 1 29 16
Sophie Ecclestone: T20I bowling by home and away Mat Inns Balls Mdns Runs Wkts BBI Avg Econ SR 4w 5w Home 61 61 1,354 4 1,478 81 4/18 18.24 6.54 16.71 2 0 Away 27 27 631 3 633 39 3/15 16.23 6.01 16.17 0 0 Neutral 24 24 532 3 424 34 3/7 12.47 4.78 15.64 0 0 All 113 112 2,517 10 2,535 154 4/18 16.46 6.04 16.34 2 0
Sophie Ecclestone: T20I batting by batting first or chasing Mat Inns NO Runs HS Avg BF SR 100 50 0 4s 6s Batting first 31 31 18 270 33* 20.76 195 138.46 0 0 1 21 13 Chasing 16 16 8 98 35 12.25 82 119.51 0 0 0 8 3 All 113 47 26 368 35 17.52 277 132.85 0 0 1 29 16
Sophie Ecclestone: T20I bowling by bowling first or defending Mat Inns Balls Mdns Runs Wkts BBI Avg Econ SR 4w 5w Bowling first 51 51 1,157 6 1,234 69 4/25 17.88 6.39 16.76 1 0 Defending a total 61 61 1,360 4 1,301 85 4/18 15.30 5.73 16.00 1 0 All 113 112 2,517 10 2,535 154 4/18 16.46 6.04 16.34 2 0
Sophie Ecclestone: T20I batting by batting position Mat Inns NO Runs HS Avg BF SR 100 50 0 4s 6s No. 7 7 7 3 36 11* 9.00 37 97.29 0 0 0 0 2 No. 8 21 21 13 220 35 27.50 144 152.77 0 0 1 20 10 No. 9 16 16 10 97 17* 16.16 77 125.97 0 0 0 9 3 No. 10 3 3 0 15 6 5.00 19 78.94 0 0 0 0 1 All 113 47 26 368 35 17.52 277 132.85 0 0 1 29 16
Sophie Ecclestone: T20I batting by match result Mat Inns NO Runs HS Avg BF SR 100 50 0 4s 6s Won 25 25 20 196 33* 39.20 117 167.52 0 0 0 18 8 Lost 22 22 6 172 35 10.75 160 107.50 0 0 1 11 8 All 113 47 26 368 35 17.52 277 132.85 0 0 1 29 16
Sophie Ecclestone: T20I bowling by match result Mat Inns Balls Mdns Runs Wkts BBI Avg Econ SR 4w 5w Won 82 82 1,846 9 1,729 122 4/18 14.17 5.61 15.13 2 0 Lost 29 29 647 1 780 31 3/22 25.16 7.23 20.87 0 0 Tied 1 1 24 0 26 1 1/26 26.00 6.50 24.00 0 0 All 113 112 2,517 10 2,535 154 4/18 16.46 6.04 16.34 2 0
Sophie Ecclestone: T20I batting by year Mat Inns NO Runs HS Avg BF SR 100 50 0 4s 6s 2017 1 1 0 6 6 6.00 2 300.00 0 0 0 0 1 2018 4 4 1 20 9* 6.66 26 76.92 0 0 0 1 0 2019 2 2 1 19 17* 19.00 15 126.66 0 0 0 1 1 2020 5 5 5 20 9* N/A 13 153.84 0 0 0 3 0 2021 4 4 2 28 9* 14.00 29 96.55 0 0 0 1 1 2022 7 7 5 72 33* 36.00 55 130.90 0 0 0 6 4 2023 7 7 3 45 22 11.25 35 128.57 0 0 1 3 2 2024 8 8 6 57 19* 28.50 32 178.12 0 0 0 5 3 2025 7 7 2 84 35 16.80 62 135.48 0 0 0 6 4 2026 2 2 1 17 13 17.00 8 212.50 0 0 0 3 0 All 113 47 26 368 35 17.52 277 132.85 0 0 1 29 16
Sophie Ecclestone: T20I bowling by year Mat Inns Balls Mdns Runs Wkts BBI Avg Econ SR 4w 5w 2016 2 2 48 0 47 3 2/26 15.66 5.87 16.00 0 0 2017 3 3 71 0 84 4 2/24 21.00 7.09 17.75 0 0 2018 14 14 315 1 350 17 4/18 20.58 6.66 18.52 1 0 2019 7 7 150 2 149 13 3/21 11.46 5.96 11.53 0 0 2020 13 13 289 1 236 19 3/7 12.42 4.89 15.21 0 0 2021 9 9 197 2 189 11 3/35 17.18 5.75 17.90 0 0 2022 16 16 348 3 340 19 3/25 17.89 5.86 18.31 0 0 2023 11 11 259 1 244 23 3/13 10.60 5.65 11.26 0 0 2024 17 17 383 0 357 24 4/25 14.87 5.59 15.95 1 0 2025 8 8 186 0 241 9 2/26 26.77 7.77 20.66 0 0 2026 12 12 271 0 298 12 3/22 24.83 6.59 22.58 0 0 All 113 112 2,517 10 2,535 154 4/18 16.46 6.04 16.34 2 0
Sophie Ecclestone: T20I batting by ground Mat Inns NO Runs HS Avg BF SR 100 50 0 4s 6s The County Ground 12 12 9 114 33* 38.00 74 154.05 0 0 0 12 4 Edgbaston 6 6 4 48 19* 24.00 37 129.72 0 0 1 4 2 All 113 47 26 368 35 17.52 277 132.85 0 0 1 29 16
Sophie Ecclestone: T20I bowling by ground Mat Inns Balls Mdns Runs Wkts BBI Avg Econ SR 4w 5w The County Ground 24 24 533 2 596 31 4/18 19.22 6.70 17.19 1 0 Edgbaston 9 9 197 0 203 12 3/25 16.91 6.18 16.41 0 0 Manuka Oval 7 7 168 0 164 9 2/12 18.22 5.85 18.66 0 0 County Ground, Bristol 6 6 138 1 149 9 3/22 16.55 6.47 15.33 0 0 Kennington Oval 5 5 120 0 120 6 2/16 20.00 6.00 20.00 0 0 Brabourne Stadium 4 4 84 0 111 2 1/15 55.50 7.92 42.00 0 0 Lord's 4 4 91 0 107 3 1/22 35.66 7.05 30.33 0 0 County Ground, Northampton 3 3 47 0 47 4 3/11 11.75 6.00 11.75 0 0 Darren Sammy National Cricket Stadium 3 3 72 0 71 2 1/20 35.50 5.91 36.00 0 0 Kensington Oval 3 3 60 1 49 4 2/13 12.25 4.90 15.00 0 0 Kinrara Academy Oval 3 3 54 1 38 6 3/21 6.33 4.22 9.00 0 0 Sharjah Cricket Stadium 3 3 72 0 49 4 2/13 12.25 4.08 18.00 0 0 Sir Vivian Richards Stadium 3 3 69 1 40 3 2/22 13.33 3.47 23.00 0 0 Sky Stadium 3 3 72 1 51 5 2/18 10.20 4.25 14.40 0 0 The Rose Bowl 3 3 66 0 75 6 3/22 12.50 6.81 11.00 0 0 All 113 112 2,517 10 2,535 154 4/18 16.46 6.04 16.34 2 0
Sophie Ecclestone: T20I batting by series and tournaments Mat Inns NO Runs HS Avg BF SR 100 50 0 4s 6s ICC Women's T20 World Cup 9 9 6 38 11* 12.66 26 146.15 0 0 0 1 3 India Women tour of England 9 9 5 100 35 25.00 71 140.84 0 0 0 8 4 Women's Ashes 4 4 0 40 22 10.00 31 129.03 0 0 1 3 2 Commonwealth Games Women's Cricket Competition 3 3 2 25 18 25.00 23 108.69 0 0 0 1 2 New Zealand Women tour of England 3 3 2 19 8* 19.00 15 126.66 0 0 0 1 1 Pakistan Women tour of England 3 3 2 28 19* 28.00 17 164.70 0 0 0 4 0 West Indies Women tour of England 3 3 3 17 9* N/A 10 170.00 0 0 0 3 0 All 113 47 26 368 35 17.52 277 132.85 0 0 1 29 16
Sophie Ecclestone: T20I bowling by series and tournaments Mat Inns Balls Mdns Runs Wkts BBI Avg Econ SR 4w 5w ICC Women's T20 World Cup 25 25 587 2 472 39 3/7 12.10 4.82 15.05 0 0 India Women tour of England 14 14 300 2 376 13 3/25 28.92 7.52 23.07 0 0 New Zealand Women tour of England 10 10 215 0 234 12 4/25 19.50 6.53 17.91 1 0 Women's Ashes 7 7 167 0 215 10 2/24 21.50 7.72 16.70 0 0 Commonwealth Games Women's Cricket Competition 5 5 102 0 107 5 3/25 21.40 6.29 20.40 0 0 England Tri-Nation T20 Women's Series 5 5 114 1 134 10 4/18 13.40 7.05 11.40 1 0 England Women tour of New Zealand 5 5 120 1 100 9 3/30 11.11 5.00 13.33 0 0 West Indies Women tour of England 5 5 108 0 97 6 2/19 16.16 5.38 18.00 0 0 Australia Tri-Nation Women's T20 Series 4 4 90 0 90 5 2/19 18.00 6.00 18.00 0 0 England Women tour of West Indies 4 4 84 2 55 4 2/13 13.75 3.92 21.00 0 0 India Tri-Nation Women's T20 Series 4 4 84 0 111 2 1/15 55.50 7.92 42.00 0 0 Australia Women tour of England 3 3 72 1 82 6 3/22 13.66 6.83 12.00 0 0 All 113 112 2,517 10 2,535 154 4/18 16.46 6.04 16.34 2 0
Sophie Ecclestone: T20I batting by batting first or chasing Mat Inns NO Runs HS Avg BF SR 100 50 0 4s 6s Batting first 31 31 18 270 33* 20.76 195 138.46 0 0 1 21 13 Chasing 16 16 8 98 35 12.25 82 119.51 0 0 0 8 3 All 113 47 26 368 35 17.52 277 132.85 0 0 1 29 16
Sophie Ecclestone: T20I bowling by bowling first or defending Mat Inns Balls Mdns Runs Wkts BBI Avg Econ SR 4w 5w Bowling first 51 51 1,157 6 1,234 69 4/25 17.88 6.39 16.76 1 0 Defending a total 61 61 1,360 4 1,301 85 4/18 15.30 5.73 16.00 1 0 All 113 112 2,517 10 2,535 154 4/18 16.46 6.04 16.34 2 0
- not recorded in the scorecards · N/A no dismissals or balls to divide by
Best T20I performances Sophie Ecclestone: highest T20I scores Score BF SR 4s 6s Opponent Ground Date 35 23 152.17 4 1 India County Ground, Bristol 2025-07-01 33* 12 275.00 4 2 South Africa The County Ground 2022-07-25 22 12 183.33 2 1 Australia Kennington Oval 2023-07-05 19* 11 172.72 3 0 Pakistan Edgbaston 2024-05-11 18 21 85.71 1 1 New Zealand Edgbaston 2022-08-07 17* 11 154.54 1 1 Australia The County Ground 2019-07-28 16* 10 160.00 1 1 India Old Trafford 2025-07-09 13 6 216.66 1 1 Australia Sydney Cricket Ground 2025-01-20 13 7 185.71 2 0 India The County Ground 2026-05-28 11* 8 137.50 0 1 India St George's Park 2023-02-18
Sophie Ecclestone: best T20I bowling Figures Balls Mdns Econ Opponent Ground Date 4/18 24 1 4.50 New Zealand The County Ground 2018-06-23 4/25 24 0 6.25 New Zealand St Lawrence Ground 2024-07-11 3/7 19 1 2.21 West Indies Sydney Showground Stadium 2020-03-01 3/11 17 0 3.88 Pakistan County Ground, Northampton 2024-05-17 3/13 24 1 3.25 Ireland Boland Park 2023-02-13 3/15 24 0 3.75 India Wankhede Stadium 2023-12-06 3/21 18 0 7.00 Pakistan Kinrara Academy Oval 2019-12-17 3/22 24 1 5.50 Australia County Ground, Bristol 2019-07-31 3/22 24 0 5.50 South Africa Newlands 2023-02-24 3/22 24 0 5.50 Ireland The Rose Bowl 2026-06-16
Latest T20I matches Latest T20I matches Date Opponent Bat Bowl Ground Result 2026-07-05 Australia did not bat 1/24 Lord's Australia won by 7 wickets 2026-07-02 South Africa did not bat 1/21 Kennington Oval England won by 40 runs 2026-06-27 New Zealand did not bat 0/24 Kennington Oval England won by 9 wickets 2026-06-24 West Indies 4* 1/22 Lord's England won by 38 runs 2026-06-20 Scotland did not bat 2/23 Headingley England won by 38 runs 2026-06-16 Ireland did not bat 3/22 The Rose Bowl England won by 4 wickets 2026-06-12 Sri Lanka did not bat 2/27 Edgbaston England won by 87 runs 2026-06-02 India did not bat 0/33 The County Ground England won by 6 wickets 2026-05-30 India did not bat 1/24 County Ground, Bristol England won by 26 runs 2026-05-28 India 13 0/33 The County Ground India won by 38 runs
Questions about Sophie Ecclestone How many Test runs has Sophie Ecclestone scored? Sophie Ecclestone has 257 runs in 16 women's Test innings from 10 matches at an average of 19.76 and a strike rate of 46.55. Highest score: 50. Full answer →
What is Sophie Ecclestone's Test batting average? Sophie Ecclestone's Test batting average in women's internationals is 19.76, from 257 runs and 16 innings. Full answer →
How many Test wickets has Sophie Ecclestone taken? Sophie Ecclestone has taken 48 wickets in women's Test from 10 matches at a bowling average of 28.66. Best innings: 5/63. Full answer →
How many ODI runs has Sophie Ecclestone scored? Sophie Ecclestone has 426 runs in 56 women's ODI innings from 84 matches at an average of 10.65 and a strike rate of 71.23. Highest score: 33*. Full answer →
What is Sophie Ecclestone's ODI batting average? Sophie Ecclestone's ODI batting average in women's internationals is 10.65, from 426 runs and 56 innings. Full answer →
How many ODI wickets has Sophie Ecclestone taken? Sophie Ecclestone has taken 141 wickets in women's ODI from 84 matches at a bowling average of 19.37. Best innings: 6/36. Full answer →