Home / Players / Kevin O'Brien Overview Test3 ODI153 T20I110 T20 World Cup18 Recent scores Oldest on the left. Recorded scorecards only. The top edge marks the result for their side.
Last 12 batting innings 301 Runs
25.08 Average
109.85 Strike rate
Career records by format Batting career records by format Format Mat Inns NO Runs HS Avg BF SR 100s 50s 0s 4s 6s Test 3 6 1 258 118 51.60 467 55.24 1 1 0 29 0 ODI 153 141 18 3,619 142 29.42 4,076 88.78 2 18 6 332 84 T20I 110 103 10 1,973 124 21.21 1,507 130.92 1 5 12 165 82
Bowling career records by format Format Mat Inns Balls Mdns Runs Wkts BBI BBM Avg Econ SR 4w 5w 10w Test 3 2 60 2 31 0 - - N/A 3.10 N/A 0 0 0 ODI 153 116 4,296 30 3,726 114 4/13 4/13 32.68 5.20 37.68 5 0 - T20I 110 52 917 0 1,149 58 4/45 4/45 19.81 7.51 15.81 1 0 -
Fielding career records by format Format Mat Inns Ct St Dis Dis/inns Best Test 3 6 0 0 0 0.000 0 ODI 153 149 67 0 67 0.449 3 (3ct 0st) T20I 110 106 40 0 40 0.377 2 (2ct 0st)
Runs by format
258 4% 3,619 62% 1,973 34%
Wickets by format
114 66% 58 34%
Career records checked 2026-11-09. Independent of the scorecard archive.
IPL and T20 World Cup IPL and T20 World Cup records Competition Span Mat Runs Avg SR Wkts Econ BBI T20 World Cup 2009 to 2021 18 238 17.00 122.05 9 7.67 2/17
From ball-by-ball data. T20 World Cup matches are also part of the T20I record above.
Ireland · Compare with another player
Innings explorer 262 scorecards Open explorer
Scorecard coverage Scorecard coverage of the official career Format Official bat inns In scorecards Official bowl inns In scorecards First Latest Coverage Test 6 6 2 2 2018-05-11 2019-07-24 Complete ODI 141 141 116 116 2006-06-13 2021-06-07 Complete T20I 103 103 52 52 2008-08-02 2021-10-22 Complete
258 Runs
51.60 Average
55.24 Strike rate
1 Hundreds
1 Fifties
118 Highest
Recent scores Oldest on the left. Recorded scorecards only. The top edge marks the result for their side.
Last 6 batting innings 258 Runs
51.60 Average
55.24 Strike rate
1 Hundreds
Official Test record Official Test batting record Batting Mat Inns NO Runs HS Avg BF SR 100 50 0 4s 6s Career 3 6 1 258 118 51.60 467 55.24 1 1 0 29 0
Official Test bowling record Bowling Mat Inns Balls Mdns Runs Wkts BBI BBM Avg Econ SR 4w 5w 10w Career 3 2 60 2 31 0 - - N/A 3.10 N/A 0 0 0
Test career in charts Test runs by year 0 40 80 120 2018: 158 runs 158 2018 2019: 100 runs 100 2019 Last 20 Test innings
0 1-49 50-99 100+ * not out
Test innings by score How Test innings ended Caught 2 · 33.3%
LBW 3 · 50.0%
Not out 1 · 16.7%
Test batting position: average and innings Test runs from boundaries Fours 116 · 45.0%
Other runs 142 · 55.0%
Test record by situation complete career Opposition Home and away Match innings Batting position Match result Year
Kevin O'Brien: Test batting by opposition Mat Inns NO Runs HS Avg BF SR 100 50 0 4s 6s Afghanistan 1 2 0 68 56 34.00 101 67.32 0 1 0 9 0 England 1 2 1 32 28* 32.00 81 39.50 0 0 0 3 0 Pakistan 1 2 0 158 118 79.00 285 55.43 1 0 0 17 0 All 3 6 1 258 118 51.60 467 55.24 1 1 0 29 0
Kevin O'Brien: Test batting by home and away Mat Inns NO Runs HS Avg BF SR 100 50 0 4s 6s Home 1 2 0 158 118 79.00 285 55.43 1 0 0 17 0 Away 1 2 1 32 28* 32.00 81 39.50 0 0 0 3 0 Neutral 1 2 0 68 56 34.00 101 67.32 0 1 0 9 0 All 3 6 1 258 118 51.60 467 55.24 1 1 0 29 0
Kevin O'Brien: Test batting by match innings Mat Inns NO Runs HS Avg BF SR 100 50 0 4s 6s 1st innings of the match 1 1 0 12 12 12.00 23 52.17 0 0 0 2 0 2nd innings of the match 2 2 1 68 40 68.00 141 48.22 0 0 0 7 0 3rd innings of the match 2 2 0 174 118 87.00 295 58.98 1 1 0 19 0 4th innings of the match 1 1 0 4 4 4.00 8 50.00 0 0 0 1 0 All 3 6 1 258 118 51.60 467 55.24 1 1 0 29 0
Kevin O'Brien: Test batting by batting position Mat Inns NO Runs HS Avg BF SR 100 50 0 4s 6s No. 5 2 4 1 100 56 33.33 182 54.94 0 1 0 12 0 No. 6 1 2 0 158 118 79.00 285 55.43 1 0 0 17 0 All 3 6 1 258 118 51.60 467 55.24 1 1 0 29 0
Kevin O'Brien: Test batting by match result Mat Inns NO Runs HS Avg BF SR 100 50 0 4s 6s Lost 3 6 1 258 118 51.60 467 55.24 1 1 0 29 0 All 3 6 1 258 118 51.60 467 55.24 1 1 0 29 0
Kevin O'Brien: Test batting by year Mat Inns NO Runs HS Avg BF SR 100 50 0 4s 6s 2018 1 2 0 158 118 79.00 285 55.43 1 0 0 17 0 2019 2 4 1 100 56 33.33 182 54.94 0 1 0 12 0 All 3 6 1 258 118 51.60 467 55.24 1 1 0 29 0
- not recorded in the scorecards · N/A no dismissals or balls to divide by
Best Test performances Kevin O'Brien: highest Test scores Score BF SR 4s 6s Opponent Ground Date 118 217 54.37 12 0 Pakistan Malahide Cricket Ground 2018-05-11 56 78 71.79 7 0 Afghanistan Dehradun 2019-03-15 40 68 58.82 5 0 Pakistan Malahide Cricket Ground 2018-05-11 28* 73 38.35 2 0 England Lord's 2019-07-24 12 23 52.17 2 0 Afghanistan Dehradun 2019-03-15 4 8 50.00 1 0 England Lord's 2019-07-24
Latest Test matches Latest Test matches Date Opponent Bat Bowl Ground Result 2019-07-24 England 28* & 4 - Lord's England won by 143 runs 2019-03-15 Afghanistan 12 & 56 0/11 Dehradun Afghanistan won by 7 wickets 2018-05-11 Pakistan 40 & 118 0/20 Malahide Cricket Ground Pakistan won by 5 wickets
3,619 Runs
29.42 Average
88.78 Strike rate
2 Hundreds
18 Fifties
142 Highest
Recent scores Oldest on the left. Recorded scorecards only. The top edge marks the result for their side.
Last 12 batting innings 164 Runs
16.40 Average
82.82 Strike rate
Last 12 bowling innings 4 Wickets
1/21 Best
4.29 Economy
Official ODI record Official ODI batting record Batting Mat Inns NO Runs HS Avg BF SR 100 50 0 4s 6s Career 153 141 18 3,619 142 29.42 4,076 88.78 2 18 6 332 84
Official ODI bowling record Bowling Mat Inns Balls Mdns Runs Wkts BBI BBM Avg Econ SR 4w 5w 10w Career 153 116 4,296 30 3,726 114 4/13 4/13 32.68 5.20 37.68 5 0 -
Official ODI fielding record Fielding Mat Inns Ct St Dis Dis/Inns Best Career 153 149 67 0 67 0.449 3 (3ct 0st)
ODI career in charts ODI batting form: average over 20 innings 20 40 60 Overall 29.4 Best spell: 43.3 up to 2011-05-28 Best 43.3 Latest: 19.8 2007 2010 2013 2016 2019 ODI runs by year 0 200 400 2006: 59 runs 59 2006 2007: 514 runs 514 2008: 190 runs 190 2009: 121 runs 121 2009 2010: 452 runs 452 2011: 324 runs 324 2012: 89 runs 89 2012 2013: 184 runs 184 2014: 181 runs 181 2015: 226 runs 226 2015 2016: 289 runs 289 2017: 211 runs 211 2018: 332 runs 332 2018 2019: 318 runs 318 2020: 102 runs 102 2021: 27 runs 27 2021 Last 20 ODI innings
0 1-49 50-99 100+ * not out
ODI innings by score How ODI innings ended Caught 74 · 52.5%
Bowled 18 · 12.8%
LBW 16 · 11.3%
Run out 9 · 6.4%
Stumped 3 · 2.1%
Caught and bowled 3 · 2.1%
Not out 18 · 12.8%
ODI batting position: average and innings ODI runs from boundaries Fours 1,328 · 36.7%
Sixes 504 · 13.9%
Other runs 1,787 · 49.4%
ODI bowling form: wickets per innings over 10 innings 1 Overall 0.98 Best spell: 1.90 up to 2017-03-22 Best 1.90 Latest: 0.30 2007 2010 2013 2016 2019 ODI wickets by year 0 7 14 21 2006: 1 wicket 1 2006 2007: 9 wickets 9 2008: 5 wickets 5 2009: 3 wickets 3 2009 2010: 25 wickets 25 2011: 6 wickets 6 2012: 0 wickets 2012 2013: 13 wickets 13 2014: 2 wickets 2 2015: 13 wickets 13 2015 2016: 13 wickets 13 2017: 10 wickets 10 2018: 12 wickets 12 2018 2019: 1 wicket 1 2020: 0 wickets 2021: 1 wicket 1 2021 Last 20 ODI bowling innings
ODI innings by wickets
ODI record by situation complete career Opposition Home and away Batting first or chasing Batting position Match result Year Ground Series and tournaments Bowling first or defending
Kevin O'Brien: ODI batting by opposition Mat Inns NO Runs HS Avg BF SR 100 50 0 4s 6s Afghanistan 25 25 3 603 75 27.40 738 81.70 0 2 0 58 10 Scotland 15 15 5 455 98* 45.50 506 89.92 0 3 1 40 12 Zimbabwe 13 13 2 265 73* 24.09 391 67.77 0 1 0 25 6 England 12 12 1 285 113 25.90 263 108.36 1 0 0 24 11 West Indies 12 12 0 348 68 29.00 373 93.29 0 3 1 31 8 Bangladesh 9 9 1 179 48 22.37 245 73.06 0 0 0 14 3 Netherlands 9 9 1 138 34 17.25 126 109.52 0 0 2 8 5 Canada 7 7 2 272 89* 54.40 324 83.95 0 2 0 24 4 Kenya 7 7 0 310 142 44.28 338 91.71 1 1 1 24 11 Pakistan 7 7 2 172 84* 34.40 197 87.30 0 1 0 22 2 United Arab Emirates 7 7 1 227 69 37.83 158 143.67 0 3 0 29 5 South Africa 4 4 0 114 48 28.50 132 86.36 0 0 0 13 1 Sri Lanka 4 4 0 78 64 19.50 63 123.80 0 1 1 7 3 Australia 3 3 0 44 23 14.66 79 55.69 0 0 0 5 0 India 3 3 0 13 9 4.33 26 50.00 0 0 0 1 0 New Zealand 2 2 0 50 49 25.00 48 104.16 0 0 0 2 3 Bermuda 1 1 0 54 54 54.00 57 94.73 0 1 0 5 0 Papua New Guinea 1 1 0 12 12 12.00 12 100.00 0 0 0 0 0 All 153 141 18 3,619 142 29.42 4,076 88.78 2 18 6 332 84
Kevin O'Brien: ODI bowling by opposition Mat Inns Balls Mdns Runs Wkts BBI Avg Econ SR 4w 5w Afghanistan 17 17 712 5 556 25 4/26 22.24 4.68 28.48 2 0 Scotland 16 16 608 5 481 10 3/31 48.10 4.74 60.80 0 0 Zimbabwe 11 11 456 4 373 13 3/27 28.69 4.90 35.07 0 0 Netherlands 9 9 384 7 269 17 4/13 15.82 4.20 22.58 1 0 Bangladesh 8 8 253 0 223 5 2/58 44.60 5.28 50.60 0 0 Canada 7 7 222 3 157 7 2/21 22.42 4.24 31.71 0 0 England 7 7 228 1 234 2 1/26 117.00 6.15 114.00 0 0 Pakistan 7 7 276 0 261 5 2/43 52.20 5.67 55.20 0 0 West Indies 7 7 228 0 266 5 4/71 53.20 7.00 45.60 1 0 Kenya 6 6 150 1 121 3 1/13 40.33 4.84 50.00 0 0 United Arab Emirates 5 5 204 2 168 9 4/41 18.66 4.94 22.66 1 0 Sri Lanka 4 4 126 0 141 2 1/10 70.50 6.71 63.00 0 0 India 3 3 71 0 70 0 0/3 N/A 5.91 N/A 0 0 South Africa 3 3 114 0 176 3 2/66 58.66 9.26 38.00 0 0 Australia 2 2 102 1 73 3 3/43 24.33 4.29 34.00 0 0 New Zealand 2 2 72 0 66 1 1/46 66.00 5.50 72.00 0 0 Bermuda 1 1 48 1 38 2 2/38 19.00 4.75 24.00 0 0 Papua New Guinea 1 1 42 0 53 2 2/53 26.50 7.57 21.00 0 0 All 153 116 4,296 30 3,726 114 4/13 32.68 5.20 37.68 5 0
Kevin O'Brien: ODI batting by home and away Mat Inns NO Runs HS Avg BF SR 100 50 0 4s 6s Home 49 49 5 1,183 84* 26.88 1,263 93.66 0 7 1 118 22 Away 41 41 2 967 142 24.79 1,127 85.80 1 4 3 84 24 Neutral 50 50 11 1,445 113 37.05 1,670 86.52 1 7 2 129 37 Unknown 1 1 0 24 24 24.00 16 150.00 0 0 0 1 1 All 153 141 18 3,619 142 29.42 4,076 88.78 2 18 6 332 84
Kevin O'Brien: ODI bowling by home and away Mat Inns Balls Mdns Runs Wkts BBI Avg Econ SR 4w 5w Home 47 47 1,643 11 1,320 40 4/45 33.00 4.82 41.07 1 0 Away 29 29 1,044 6 837 32 4/13 26.15 4.81 32.62 2 0 Neutral 40 40 1,609 13 1,569 42 4/26 37.35 5.85 38.30 2 0 All 153 116 4,296 30 3,726 114 4/13 32.68 5.20 37.68 5 0
Kevin O'Brien: ODI batting by batting first or chasing Mat Inns NO Runs HS Avg BF SR 100 50 0 4s 6s Batting first 74 74 2 1,743 142 24.20 1,955 89.15 1 7 3 156 41 Chasing 67 67 16 1,876 113 36.78 2,121 88.44 1 11 3 176 43 All 153 141 18 3,619 142 29.42 4,076 88.78 2 18 6 332 84
Kevin O'Brien: ODI bowling by bowling first or defending Mat Inns Balls Mdns Runs Wkts BBI Avg Econ SR 4w 5w Bowling first 65 65 2,624 21 2,316 70 4/26 33.08 5.29 37.48 3 0 Defending a total 51 51 1,672 9 1,410 44 4/13 32.04 5.05 38.00 2 0 All 153 116 4,296 30 3,726 114 4/13 32.68 5.20 37.68 5 0
Kevin O'Brien: ODI batting by batting position Mat Inns NO Runs HS Avg BF SR 100 50 0 4s 6s No. 1 1 1 0 0 0 0.00 4 0.00 0 0 1 0 0 No. 2 4 4 0 27 23 6.75 33 81.81 0 0 0 5 0 No. 3 1 1 1 50 50* N/A 26 192.30 0 1 0 7 1 No. 4 13 13 4 481 98* 53.44 549 87.61 0 4 2 47 8 No. 5 64 64 8 1,707 142 30.48 1,961 87.04 1 9 1 150 37 No. 6 47 47 5 1,146 113 27.28 1,281 89.46 1 3 1 104 32 No. 7 9 9 0 149 50 16.55 158 94.30 0 1 1 15 5 No. 8 2 2 0 59 35 29.50 64 92.18 0 0 0 4 1 All 153 141 18 3,619 142 29.42 4,076 88.78 2 18 6 332 84
Kevin O'Brien: ODI batting by match result Mat Inns NO Runs HS Avg BF SR 100 50 0 4s 6s Won 59 59 16 1,817 113 42.25 1,880 96.64 1 11 3 178 45 Lost 77 77 1 1,655 142 21.77 2,081 79.52 1 6 3 136 35 Tied 3 3 1 98 84* 49.00 81 120.98 0 1 0 13 2 No result 2 2 0 49 25 24.50 34 144.11 0 0 0 5 2 All 153 141 18 3,619 142 29.42 4,076 88.78 2 18 6 332 84
Kevin O'Brien: ODI bowling by match result Mat Inns Balls Mdns Runs Wkts BBI Avg Econ SR 4w 5w Won 54 54 2,055 23 1,606 65 4/13 24.70 4.68 31.61 3 0 Lost 58 58 2,127 6 2,005 43 4/45 46.62 5.65 49.46 2 0 Tied 3 3 102 1 103 6 3/52 17.16 6.05 17.00 0 0 No result 1 1 12 0 12 0 0/12 N/A 6.00 N/A 0 0 All 153 116 4,296 30 3,726 114 4/13 32.68 5.20 37.68 5 0
Kevin O'Brien: ODI batting by year Mat Inns NO Runs HS Avg BF SR 100 50 0 4s 6s 2006 2 2 0 59 35 29.50 64 92.18 0 0 0 4 1 2007 18 18 1 514 142 30.23 658 78.11 1 2 0 39 13 2008 6 6 1 190 83 38.00 224 84.82 0 1 0 15 9 2009 5 5 1 121 89* 30.25 183 66.12 0 1 0 10 1 2010 16 16 5 452 98* 41.09 655 69.00 0 3 2 32 9 2011 12 12 1 324 113 29.45 257 126.07 1 0 1 30 14 2012 3 3 0 89 39 29.66 127 70.07 0 0 0 12 1 2013 6 6 1 184 84* 36.80 155 118.70 0 1 0 22 3 2014 5 5 1 181 67 45.25 204 88.72 0 2 1 19 1 2015 12 12 0 226 50 18.83 259 87.25 0 1 1 26 4 2016 9 9 0 289 75 32.11 297 97.30 0 2 0 28 6 2017 10 10 2 211 72* 26.37 199 106.03 0 2 0 19 6 2018 13 13 2 332 50* 30.18 266 124.81 0 1 0 32 9 2019 13 13 2 318 68 28.90 374 85.02 0 2 0 30 5 2020 6 6 1 102 31 20.40 117 87.17 0 0 0 9 2 2021 5 5 0 27 23 5.40 37 72.97 0 0 1 5 0 All 153 141 18 3,619 142 29.42 4,076 88.78 2 18 6 332 84
Kevin O'Brien: ODI bowling by year Mat Inns Balls Mdns Runs Wkts BBI Avg Econ SR 4w 5w 2006 1 1 60 0 47 1 1/47 47.00 4.70 60.00 0 0 2007 15 15 414 3 377 9 2/38 41.88 5.46 46.00 0 0 2008 5 5 204 2 173 5 3/30 34.60 5.08 40.80 0 0 2009 7 7 180 2 160 3 1/13 53.33 5.33 60.00 0 0 2010 17 17 760 11 542 25 3/18 21.68 4.27 30.40 0 0 2011 9 9 210 1 192 6 4/71 32.00 5.48 35.00 1 0 2012 1 1 6 0 10 0 0/10 N/A 10.00 N/A 0 0 2013 7 7 288 0 237 13 4/13 18.23 4.93 22.15 1 0 2014 5 5 126 0 83 2 1/10 41.50 3.95 63.00 0 0 2015 12 12 535 3 596 13 3/49 45.84 6.68 41.15 0 0 2016 9 9 481 1 450 13 4/45 34.61 5.61 37.00 1 0 2017 10 10 385 2 322 10 4/26 32.20 5.01 38.50 1 0 2018 9 9 440 4 386 12 4/41 32.16 5.26 36.66 1 0 2019 6 6 135 0 97 1 1/21 97.00 4.31 135.00 0 0 2021 3 3 72 1 54 1 1/22 54.00 4.50 72.00 0 0 All 153 116 4,296 30 3,726 114 4/13 32.68 5.20 37.68 5 0
Kevin O'Brien: ODI batting by ground Mat Inns NO Runs HS Avg BF SR 100 50 0 4s 6s Civil Service Cricket Club, Stormont 22 22 2 417 75 20.85 550 75.81 0 1 0 36 4 Clontarf Cricket Club Ground 15 15 2 421 84* 32.38 395 106.58 0 2 1 46 11 Harare Sports Club 11 11 1 284 73* 28.40 333 85.28 0 1 0 26 6 Malahide Cricket Ground 10 10 1 276 67 30.66 262 105.34 0 3 0 29 4 ICC Academy, Dubai 5 5 1 161 69 40.25 115 140.00 0 1 0 13 6 Sabina Park 5 5 1 119 54 29.75 213 55.86 0 1 0 8 2 Dehradun 4 4 1 90 33* 30.00 138 65.21 0 0 0 7 1 Kensington Oval 4 4 0 99 48 24.75 102 97.05 0 0 0 9 3 Sheikh Zayed Stadium 4 4 0 27 23 6.75 33 81.81 0 0 0 5 0 Shere Bangla National Stadium 4 4 0 96 37 24.00 144 66.66 0 0 0 10 1 Amstelveen 3 3 1 102 98* 51.00 111 91.89 0 1 1 4 3 Dubai International Cricket Stadium 3 3 0 64 30 21.33 87 73.56 0 0 0 6 1 Nairobi (Gym) 3 3 0 99 83 33.00 78 126.92 0 1 0 7 5 Sharjah Cricket Stadium 3 3 1 24 11 12.00 35 68.57 0 0 0 2 1 The Rose Bowl 3 3 1 46 22 23.00 58 79.31 0 0 0 1 1 All 153 141 18 3,619 142 29.42 4,076 88.78 2 18 6 332 84
Kevin O'Brien: ODI bowling by ground Mat Inns Balls Mdns Runs Wkts BBI Avg Econ SR 4w 5w Civil Service Cricket Club, Stormont 21 21 802 3 608 20 4/45 30.40 4.54 40.10 1 0 Clontarf Cricket Club Ground 15 15 450 8 345 16 3/18 21.56 4.60 28.12 0 0 Harare Sports Club 10 10 396 3 358 12 3/27 29.83 5.42 33.00 0 0 Malahide Cricket Ground 10 10 331 0 321 3 1/22 107.00 5.81 110.33 0 0 ICC Academy, Dubai 5 5 254 3 193 8 4/41 24.12 4.55 31.75 1 0 Sabina Park 5 5 114 1 85 2 1/8 42.50 4.47 57.00 0 0 Shere Bangla National Stadium 4 4 120 0 108 2 2/58 54.00 5.40 60.00 0 0 Willowmoore Park 4 4 162 0 161 3 2/66 53.66 5.96 54.00 0 0 Amstelveen 3 3 144 1 128 6 3/52 21.33 5.33 24.00 0 0 Dubai International Cricket Stadium 3 3 126 3 104 4 3/49 26.00 4.95 31.50 0 0 Sharjah Cricket Stadium 3 3 108 1 93 1 1/50 93.00 5.16 108.00 0 0 Sheikh Zayed Stadium 3 3 72 1 54 1 1/22 54.00 4.50 72.00 0 0 All 153 116 4,296 30 3,726 114 4/13 32.68 5.20 37.68 5 0
Kevin O'Brien: ODI batting by series and tournaments Mat Inns NO Runs HS Avg BF SR 100 50 0 4s 6s ICC Cricket World Cup 12 12 1 329 113 29.90 289 113.84 1 1 1 35 12 ICC World Cup 8 8 1 170 49 24.28 263 64.63 0 0 0 13 5 ICC World Cricket League Championship 6 6 0 171 43 28.50 173 98.84 0 0 0 16 4 ICC Cricket World Cup Qualifier (ICC Trophy) 5 5 1 153 50* 38.25 116 131.89 0 1 0 18 3 Ireland Tri-Nation Series 5 5 0 145 68 29.00 135 107.40 0 2 0 11 4 United Arab Emirates Tri-Nation Series 4 4 1 92 46 30.66 62 148.38 0 0 0 6 5 Ireland in Zimbabwe ODI Series 3 3 0 31 16 10.33 41 75.60 0 0 0 4 0 Ireland tour of England 3 3 1 46 22 23.00 58 79.31 0 0 0 1 1 Ireland tour of West Indies 3 3 0 56 31 18.66 59 94.91 0 0 0 8 1 Pakistan in Ireland ODI Series 3 3 1 126 84* 63.00 97 129.89 0 1 0 17 2 Scotland in Ireland ODI Series 3 3 1 159 67 79.50 168 94.64 0 2 0 19 1 Zimbabwe tour of Netherlands and Ireland 3 3 1 46 35* 23.00 57 80.70 0 0 0 6 0 All 153 141 18 3,619 142 29.42 4,076 88.78 2 18 6 332 84
Kevin O'Brien: ODI bowling by series and tournaments Mat Inns Balls Mdns Runs Wkts BBI Avg Econ SR 4w 5w ICC Cricket World Cup 10 10 401 0 523 10 4/71 52.30 7.82 40.10 1 0 ICC World Cup 6 6 108 1 100 3 1/8 33.33 5.55 36.00 0 0 ICC World Cricket League Championship 5 5 108 1 54 5 4/13 10.80 3.00 21.60 1 0 ICC Cricket World Cup Qualifier (ICC Trophy) 4 4 144 1 153 3 2/53 51.00 6.37 48.00 0 0 Ireland Tri-Nation Series 4 4 109 0 90 2 1/22 45.00 4.95 54.50 0 0 United Arab Emirates Tri-Nation Series 4 4 236 3 188 8 4/41 23.50 4.77 29.50 1 0 Ireland in Zimbabwe ODI Series 3 3 110 0 84 3 2/46 28.00 4.58 36.66 0 0 Pakistan in Ireland ODI Series 3 3 126 0 139 3 2/43 46.33 6.61 42.00 0 0 Scotland in Ireland ODI Series 3 3 96 0 55 1 1/32 55.00 3.43 96.00 0 0 All 153 116 4,296 30 3,726 114 4/13 32.68 5.20 37.68 5 0
Kevin O'Brien: ODI batting by batting first or chasing Mat Inns NO Runs HS Avg BF SR 100 50 0 4s 6s Batting first 74 74 2 1,743 142 24.20 1,955 89.15 1 7 3 156 41 Chasing 67 67 16 1,876 113 36.78 2,121 88.44 1 11 3 176 43 All 153 141 18 3,619 142 29.42 4,076 88.78 2 18 6 332 84
Kevin O'Brien: ODI bowling by bowling first or defending Mat Inns Balls Mdns Runs Wkts BBI Avg Econ SR 4w 5w Bowling first 65 65 2,624 21 2,316 70 4/26 33.08 5.29 37.48 3 0 Defending a total 51 51 1,672 9 1,410 44 4/13 32.04 5.05 38.00 2 0 All 153 116 4,296 30 3,726 114 4/13 32.68 5.20 37.68 5 0
- not recorded in the scorecards · N/A no dismissals or balls to divide by
Best ODI performances Kevin O'Brien: highest ODI scores Score BF SR 4s 6s Opponent Ground Date 142 125 113.60 10 6 Kenya Nairobi (Ruaraka) 2007-02-02 113 63 179.36 13 6 England M Chinnaswamy Stadium 2011-03-02 98* 104 94.23 4 3 Scotland Amstelveen 2010-07-10 89* 104 85.57 9 1 Canada Willowmoore Park 2009-04-06 84* 47 178.72 11 2 Pakistan Clontarf Cricket Club Ground 2013-05-23 83 52 159.61 7 5 Kenya Nairobi (Gym) 2008-10-18 75 85 88.23 7 0 Afghanistan Civil Service Cricket Club, Stormont 2016-07-14 73* 102 71.56 3 3 Zimbabwe Harare Sports Club 2010-09-28 72* 60 120.00 8 2 Afghanistan Greater Noida 2017-03-22 69 53 130.18 7 1 United Arab Emirates ICC Academy, Dubai 2017-03-02
Kevin O'Brien: best ODI bowling Figures Balls Mdns Econ Opponent Ground Date 4/13 42 0 1.85 Netherlands VRA Ground 2013-07-07 4/26 42 1 3.71 Afghanistan Greater Noida 2017-03-22 4/41 60 0 4.10 United Arab Emirates ICC Academy, Dubai 2018-01-13 4/45 60 1 4.50 Afghanistan Civil Service Cricket Club, Stormont 2016-07-12 4/71 54 0 7.88 West Indies Punjab Cricket Association IS Bindra Stadium 2011-03-11 3/18 48 2 2.25 Netherlands Clontarf Cricket Club Ground 2010-08-16 3/27 40 1 4.05 Zimbabwe Harare Sports Club 2010-09-30 3/28 55 0 3.05 Afghanistan Civil Service Cricket Club, Stormont 2016-07-14 3/30 54 2 3.33 Netherlands Clontarf Cricket Club Ground 2008-07-28 3/31 60 0 3.10 Scotland Civil Service Cricket Club, Stormont 2013-09-08
Latest ODI matches Latest ODI matches Date Opponent Bat Bowl Ground Result 2021-06-07 Netherlands 0 - Sportpark Maarschalkerweerd Netherlands won by 4 wickets 2021-01-24 Afghanistan 1 0/13 Sheikh Zayed Stadium Afghanistan won by 7 wickets 2021-01-21 Afghanistan 1 0/19 Sheikh Zayed Stadium Afghanistan won by 16 runs 2021-01-18 United Arab Emirates 2 1/22 Sheikh Zayed Stadium Ireland won by 112 runs 2021-01-08 United Arab Emirates 23 - Sheikh Zayed Stadium United Arab Emirates won by 6 wickets 2020-08-04 England 21* - The Rose Bowl Ireland won by 7 wickets 2020-08-01 England 3 - The Rose Bowl England won by 4 wickets 2020-07-30 England 22 - The Rose Bowl England won by 6 wickets 2020-01-12 West Indies 21 - National Cricket Stadium, St George's West Indies won by 5 wickets (D/L method) 2020-01-09 West Indies 31 - Kensington Oval West Indies won by 1 wicket
1,973 Runs 69th among men
21.21 Average
130.92 Strike rate
1 Hundreds 53rd among men
5 Fifties
124 Highest
Recent scores Oldest on the left. Recorded scorecards only. The top edge marks the result for their side.
Last 12 batting innings 301 Runs
25.08 Average
109.85 Strike rate
Last 12 bowling innings 12 Wickets
4/45 Best
10.53 Economy
Official T20I record Official T20I batting record Batting Mat Inns NO Runs HS Avg BF SR 100 50 0 4s 6s Career 110 103 10 1,973 124 21.21 1,507 130.92 1 5 12 165 82
Official T20I bowling record Bowling Mat Inns Balls Mdns Runs Wkts BBI BBM Avg Econ SR 4w 5w 10w Career 110 52 917 0 1,149 58 4/45 4/45 19.81 7.51 15.81 1 0 -
Official T20I fielding record Fielding Mat Inns Ct St Dis Dis/Inns Best Career 110 106 40 0 40 0.377 2 (2ct 0st)
T20I career in charts T20I batting form: average over 10 innings 20 40 60 Overall 21.2 Best spell: 44.8 up to 2019-10-07 Best 44.8 Latest: 27.4 2010 2013 2017 2019 2021 T20I runs by year 0 200 400 600 2008: 26 runs 26 2008 2009: 69 runs 69 2010: 34 runs 34 2010 2011: 0 runs 2012: 142 runs 142 2012 2013: 51 runs 51 2014: 77 runs 77 2014 2015: 109 runs 109 2016: 88 runs 88 2016 2017: 106 runs 106 2018: 73 runs 73 2018 2019: 729 runs 729 2020: 168 runs 168 2020 2021: 301 runs 301 2021 Last 20 T20I innings
0 1-49 50-99 100+ * not out
T20I innings by score How T20I innings ended Caught 62 · 60.2%
Bowled 19 · 18.4%
LBW 1 · 1.0%
Run out 3 · 2.9%
Stumped 5 · 4.9%
Caught and bowled 3 · 2.9%
Not out 10 · 9.7%
T20I batting position: average and innings T20I runs from boundaries Fours 660 · 33.5%
Sixes 492 · 24.9%
Other runs 821 · 41.6%
T20I bowling form: wickets per innings over 10 innings 1 Overall 1.12 Best spell: 1.90 up to 2016-02-14 Best 1.90 Latest: 0.90 2010 2013 2015 2017 2019 T20I wickets by year 0 3 6 9 2008: 4 wickets 4 2008 2009: 0 wickets 2010: 4 wickets 4 2010 2011: 0 wickets 2012: 11 wickets 11 2012 2013: 0 wickets 2014: 7 wickets 7 2014 2015: 11 wickets 11 2016: 9 wickets 9 2016 2017: 8 wickets 8 2018: 4 wickets 4 2018 2019: 0 wickets 2020: 0 wickets 2020 2021: 0 wickets 2021 Last 20 T20I bowling innings
T20I innings by wickets
T20I record by situation complete career Opposition Home and away Batting first or chasing Batting position Match result Year Ground Series and tournaments Bowling first or defending
Kevin O'Brien: T20I batting by opposition Mat Inns NO Runs HS Avg BF SR 100 50 0 4s 6s Afghanistan 18 18 0 271 74 15.05 213 127.23 0 1 1 22 10 Netherlands 12 12 2 254 46 25.40 170 149.41 0 0 2 18 18 Scotland 11 11 2 305 65 33.88 207 147.34 0 2 0 16 18 Zimbabwe 8 8 0 206 60 25.75 167 123.35 0 1 0 26 5 United Arab Emirates 7 7 0 189 54 27.00 171 110.52 0 1 1 11 6 West Indies 7 7 1 128 48 21.33 105 121.90 0 0 0 14 4 Bangladesh 4 4 1 44 39* 14.66 25 176.00 0 0 2 5 2 Hong Kong 4 4 0 161 124 40.25 96 167.70 1 0 1 15 8 Kenya 4 4 2 60 30* 30.00 65 92.30 0 0 0 6 1 Oman 4 4 0 113 41 28.25 70 161.42 0 0 0 9 6 Canada 3 3 0 40 31 13.33 29 137.93 0 0 0 4 1 India 3 3 0 12 10 4.00 11 109.09 0 0 1 0 1 Papua New Guinea 3 3 1 23 19* 11.50 19 121.05 0 0 1 1 1 South Africa 3 3 0 2 2 0.66 8 25.00 0 0 2 0 0 Namibia 2 2 0 42 25 21.00 38 110.52 0 0 0 2 1 Nepal 2 2 1 6 5 6.00 7 85.71 0 0 0 1 0 Sri Lanka 2 2 0 5 5 2.50 5 100.00 0 0 1 1 0 Australia 1 1 0 35 35 35.00 29 120.68 0 0 0 5 0 Bermuda 1 1 0 6 6 6.00 9 66.66 0 0 0 1 0 Jersey 1 1 0 11 11 11.00 13 84.61 0 0 0 1 0 New Zealand 1 1 0 2 2 2.00 3 66.66 0 0 0 0 0 Nigeria 1 1 0 32 32 32.00 17 188.23 0 0 0 6 0 Pakistan 1 1 0 26 26 26.00 30 86.66 0 0 0 1 0 All 110 103 10 1,973 124 21.21 1,507 130.92 1 5 12 165 82
Kevin O'Brien: T20I bowling by opposition Mat Inns Balls Mdns Runs Wkts BBI Avg Econ SR 4w 5w Afghanistan 11 11 174 0 287 8 4/45 35.87 9.89 21.75 1 0 Scotland 6 6 99 0 117 8 3/35 14.62 7.09 12.37 0 0 Netherlands 5 5 78 0 93 7 3/26 13.28 7.15 11.14 0 0 Bangladesh 3 3 54 0 71 2 1/23 35.50 7.88 27.00 0 0 India 3 3 54 0 93 4 3/40 23.25 10.33 13.50 0 0 Papua New Guinea 3 3 66 0 46 5 2/10 9.20 4.18 13.20 0 0 United Arab Emirates 3 3 72 0 68 6 3/14 11.33 5.66 12.00 0 0 West Indies 3 3 42 0 41 3 2/17 13.66 5.85 14.00 0 0 Canada 2 2 36 0 60 0 0/22 N/A 10.00 N/A 0 0 Hong Kong 2 2 48 0 71 4 3/32 17.75 8.87 12.00 0 0 Kenya 2 2 36 0 34 3 2/15 11.33 5.66 12.00 0 0 Australia 1 1 18 0 18 1 1/18 18.00 6.00 18.00 0 0 Bermuda 1 1 12 0 14 0 0/14 N/A 7.00 N/A 0 0 England 1 1 18 0 22 2 2/22 11.00 7.33 9.00 0 0 Namibia 1 1 14 0 15 0 0/15 N/A 6.42 N/A 0 0 Nepal 1 1 24 0 8 3 3/8 2.66 2.00 8.00 0 0 New Zealand 1 1 24 0 31 0 0/31 N/A 7.75 N/A 0 0 Oman 1 1 24 0 25 2 2/25 12.50 6.25 12.00 0 0 Sri Lanka 1 1 6 0 9 0 0/9 N/A 9.00 N/A 0 0 Zimbabwe 1 1 18 0 26 0 0/26 N/A 8.66 N/A 0 0 All 110 52 917 0 1,149 58 4/45 19.81 7.51 15.81 1 0
Kevin O'Brien: T20I batting by home and away Mat Inns NO Runs HS Avg BF SR 100 50 0 4s 6s Home 30 30 2 492 63 17.57 394 124.87 0 2 5 45 19 Away 19 19 2 424 54 24.94 355 119.43 0 1 0 35 15 Neutral 54 54 6 1,057 124 22.02 758 139.44 1 2 7 85 48 All 110 103 10 1,973 124 21.21 1,507 130.92 1 5 12 165 82
Kevin O'Brien: T20I bowling by home and away Mat Inns Balls Mdns Runs Wkts BBI Avg Econ SR 4w 5w Home 15 15 294 0 336 22 3/8 15.27 6.85 13.36 0 0 Away 7 7 108 0 120 8 3/14 15.00 6.66 13.50 0 0 Neutral 30 30 515 0 693 28 4/45 24.75 8.07 18.39 1 0 All 110 52 917 0 1,149 58 4/45 19.81 7.51 15.81 1 0
Kevin O'Brien: T20I batting by batting first or chasing Mat Inns NO Runs HS Avg BF SR 100 50 0 4s 6s Batting first 46 46 3 1,128 124 26.23 806 139.95 1 3 2 92 50 Chasing 57 57 7 845 74 16.90 701 120.54 0 2 10 73 32 All 110 103 10 1,973 124 21.21 1,507 130.92 1 5 12 165 82
Kevin O'Brien: T20I bowling by bowling first or defending Mat Inns Balls Mdns Runs Wkts BBI Avg Econ SR 4w 5w Bowling first 31 31 564 0 720 35 4/45 20.57 7.65 16.11 1 0 Defending a total 21 21 353 0 429 23 3/14 18.65 7.29 15.34 0 0 All 110 52 917 0 1,149 58 4/45 19.81 7.51 15.81 1 0
Kevin O'Brien: T20I batting by batting position Mat Inns NO Runs HS Avg BF SR 100 50 0 4s 6s No. 1 3 3 0 110 63 36.66 70 157.14 0 1 0 8 7 No. 2 40 40 0 1,088 124 27.20 782 139.13 1 4 3 107 42 No. 3 5 5 0 39 20 7.80 36 108.33 0 0 1 5 1 No. 4 18 18 2 216 40 13.50 210 102.85 0 0 2 13 6 No. 5 20 20 3 278 42* 16.35 212 131.13 0 0 4 14 15 No. 6 15 15 3 215 39* 17.91 177 121.46 0 0 2 17 9 No. 7 1 1 1 17 17* N/A 16 106.25 0 0 0 1 1 No. 8 1 1 1 10 10* N/A 4 250.00 0 0 0 0 1 All 110 103 10 1,973 124 21.21 1,507 130.92 1 5 12 165 82
Kevin O'Brien: T20I batting by match result Mat Inns NO Runs HS Avg BF SR 100 50 0 4s 6s Won 43 43 9 1,004 124 29.52 742 135.30 1 2 4 86 43 Lost 56 56 1 898 74 16.32 705 127.37 0 3 8 74 35 Tied 2 2 0 54 28 27.00 38 142.10 0 0 0 4 3 No result 2 2 0 17 13 8.50 22 77.27 0 0 0 1 1 All 110 103 10 1,973 124 21.21 1,507 130.92 1 5 12 165 82
Kevin O'Brien: T20I bowling by match result Mat Inns Balls Mdns Runs Wkts BBI Avg Econ SR 4w 5w Won 18 18 363 0 367 28 3/8 13.10 6.06 12.96 0 0 Lost 32 32 530 0 741 28 4/45 26.46 8.38 18.92 1 0 No result 2 2 24 0 41 2 2/22 20.50 10.25 12.00 0 0 All 110 52 917 0 1,149 58 4/45 19.81 7.51 15.81 1 0
Kevin O'Brien: T20I batting by year Mat Inns NO Runs HS Avg BF SR 100 50 0 4s 6s 2008 3 3 1 26 17* 13.00 29 89.65 0 0 0 2 1 2009 5 5 1 69 39* 17.25 56 123.21 0 0 1 5 2 2010 7 7 1 34 10* 5.66 38 89.47 0 0 1 2 1 2012 11 11 2 142 35 15.77 137 103.64 0 0 3 12 5 2013 2 2 0 51 31 25.50 35 145.71 0 0 0 4 2 2014 5 5 2 77 42* 25.66 45 171.11 0 0 1 6 5 2015 6 6 1 109 36 21.80 79 137.97 0 0 0 7 5 2016 6 6 1 88 32 17.60 84 104.76 0 0 2 6 2 2017 7 7 0 106 40 15.14 92 115.21 0 0 0 5 5 2018 8 8 1 73 28 10.42 60 121.66 0 0 1 1 5 2019 23 23 0 729 124 31.69 469 155.43 1 3 1 67 36 2020 6 6 0 168 48 28.00 106 158.49 0 0 0 20 7 2021 14 14 0 301 60 21.50 277 108.66 0 2 2 28 6 All 110 103 10 1,973 124 21.21 1,507 130.92 1 5 12 165 82
Kevin O'Brien: T20I bowling by year Mat Inns Balls Mdns Runs Wkts BBI Avg Econ SR 4w 5w 2008 3 3 60 0 58 4 2/15 14.50 5.80 15.00 0 0 2009 3 3 42 0 57 0 0/9 N/A 8.14 N/A 0 0 2010 7 7 111 0 149 4 2/22 37.25 8.05 27.75 0 0 2012 7 7 150 0 159 11 3/35 14.45 6.36 13.63 0 0 2013 1 1 12 0 22 0 0/22 N/A 11.00 N/A 0 0 2014 5 5 96 0 105 7 2/17 15.00 6.56 13.71 0 0 2015 6 6 114 0 95 11 3/8 8.63 5.00 10.36 0 0 2016 7 7 126 0 144 9 3/14 16.00 6.85 14.00 0 0 2017 7 7 126 0 209 8 4/45 26.12 9.95 15.75 1 0 2018 4 4 54 0 101 4 3/40 25.25 11.22 13.50 0 0 2019 1 1 12 0 35 0 0/35 N/A 17.50 N/A 0 0 2021 1 1 14 0 15 0 0/15 N/A 6.42 N/A 0 0 All 110 52 917 0 1,149 58 4/45 19.81 7.51 15.81 1 0
Kevin O'Brien: T20I batting by ground Mat Inns NO Runs HS Avg BF SR 100 50 0 4s 6s Dubai International Cricket Stadium 12 12 2 179 40 17.90 145 123.44 0 0 2 6 11 Bready Cricket Club 10 10 0 211 47 21.10 168 125.59 0 0 0 23 6 Civil Service Cricket Club, Stormont 10 10 2 38 17* 4.75 47 80.85 0 0 3 4 1 Sheikh Zayed Stadium 10 10 0 150 32 15.00 119 126.05 0 0 1 20 2 Al Amerat Cricket Ground Oman Cricket (Ministry Turf 1) 7 7 0 321 124 45.85 181 177.34 1 1 0 28 21 Malahide Cricket Ground 7 7 0 95 33 13.57 61 155.73 0 0 2 5 7 Greater Noida 6 6 0 99 35 16.50 77 128.57 0 0 0 10 4 Dehradun 3 3 0 116 74 38.66 82 141.46 0 1 0 7 5 ICC Academy, Dubai 3 3 0 112 54 37.33 101 110.89 0 1 0 6 3 Mombasa Sports Club Ground 3 3 1 43 30* 21.50 49 87.75 0 0 0 5 0 Sylhet International Cricket Stadium 3 3 1 59 42* 29.50 28 210.71 0 0 1 4 5 Trent Bridge 3 3 1 43 39* 21.50 24 179.16 0 0 0 4 2 All 110 103 10 1,973 124 21.21 1,507 130.92 1 5 12 165 82
Kevin O'Brien: T20I bowling by ground Mat Inns Balls Mdns Runs Wkts BBI Avg Econ SR 4w 5w Dubai International Cricket Stadium 9 9 159 0 185 12 3/35 15.41 6.98 13.25 0 0 Civil Service Cricket Club, Stormont 7 7 156 0 129 11 3/8 11.72 4.96 14.18 0 0 Bready Cricket Club 4 4 48 0 73 1 1/39 73.00 9.12 48.00 0 0 Malahide Cricket Ground 4 4 90 0 134 10 3/26 13.40 8.93 9.00 0 0 Greater Noida 3 3 72 0 132 5 4/45 26.40 11.00 14.40 1 0 Himachal Pradesh Cricket Association Stadium 3 3 36 0 56 2 2/25 28.00 9.33 18.00 0 0 Sheikh Zayed Stadium 3 3 42 0 45 3 3/14 15.00 6.42 14.00 0 0 Sylhet International Cricket Stadium 3 3 60 0 72 4 2/17 18.00 7.20 15.00 0 0 All 110 52 917 0 1,149 58 4/45 19.81 7.51 15.81 1 0
Kevin O'Brien: T20I batting by series and tournaments Mat Inns NO Runs HS Avg BF SR 100 50 0 4s 6s ICC World Twenty20 Qualifier 10 10 4 147 33 24.50 111 132.43 0 0 1 5 10 ICC Men's T20 World Cup Qualifier 8 8 0 141 41 17.62 110 128.18 0 0 1 17 2 ICC World Twenty20 8 8 1 126 39* 18.00 116 108.62 0 0 1 11 3 World T20 5 5 1 73 42* 18.25 42 173.80 0 0 2 5 5 Zimbabwe tour of Ireland and Scotland 5 5 0 148 60 29.60 131 112.97 0 1 0 17 3 Netherlands Tri-Nation T20I Series 4 4 1 54 28 18.00 41 131.70 0 0 0 1 4 Oman Pentangular T20I Series 4 4 0 191 124 47.75 99 192.92 1 0 0 17 13 ICC Men's T20 World Cup 3 3 0 39 25 13.00 37 105.40 0 0 0 5 0 Ireland in Kenya T20I Series 3 3 1 43 30* 21.50 49 87.75 0 0 0 5 0 Ireland tour of United Arab Emirates 3 3 0 112 54 37.33 101 110.89 0 1 0 6 3 Ireland tour of West Indies 3 3 0 88 48 29.33 57 154.38 0 0 0 11 3 Oman Quadrangular T20I Series 3 3 0 130 65 43.33 82 158.53 0 1 0 11 8 All 110 103 10 1,973 124 21.21 1,507 130.92 1 5 12 165 82
Kevin O'Brien: T20I bowling by series and tournaments Mat Inns Balls Mdns Runs Wkts BBI Avg Econ SR 4w 5w ICC World Twenty20 Qualifier 9 9 195 0 177 19 3/8 9.31 5.44 10.26 0 0 ICC World Twenty20 6 6 84 0 105 3 2/22 35.00 7.50 28.00 0 0 World T20 6 6 96 0 128 6 2/17 21.33 8.00 16.00 0 0 All 110 52 917 0 1,149 58 4/45 19.81 7.51 15.81 1 0
Kevin O'Brien: T20I batting by batting first or chasing Mat Inns NO Runs HS Avg BF SR 100 50 0 4s 6s Batting first 46 46 3 1,128 124 26.23 806 139.95 1 3 2 92 50 Chasing 57 57 7 845 74 16.90 701 120.54 0 2 10 73 32 All 110 103 10 1,973 124 21.21 1,507 130.92 1 5 12 165 82
Kevin O'Brien: T20I bowling by bowling first or defending Mat Inns Balls Mdns Runs Wkts BBI Avg Econ SR 4w 5w Bowling first 31 31 564 0 720 35 4/45 20.57 7.65 16.11 1 0 Defending a total 21 21 353 0 429 23 3/14 18.65 7.29 15.34 0 0 All 110 52 917 0 1,149 58 4/45 19.81 7.51 15.81 1 0
- not recorded in the scorecards · N/A no dismissals or balls to divide by
Best T20I performances Kevin O'Brien: highest T20I scores Score BF SR 4s 6s Opponent Ground Date 124 62 200.00 12 7 Hong Kong Al Amerat Cricket Ground Oman Cricket (Ministry Turf 1) 2019-10-07 74 47 157.44 5 3 Afghanistan Dehradun 2019-02-24 65 38 171.05 5 4 Scotland Al Amerat Cricket Ground Oman Cricket (Ministry Turf 1) 2019-02-15 63 45 140.00 3 4 Scotland Dublin (Malahide) 2019-09-20 60 41 146.34 7 1 Zimbabwe Clontarf Cricket Club Ground 2021-08-29 54 45 120.00 1 2 United Arab Emirates ICC Academy, Dubai 2021-10-10 48 32 150.00 4 2 West Indies National Cricket Stadium, St George's 2020-01-15 47 39 120.51 6 1 Zimbabwe Bready Cricket Club 2021-09-02 46 30 153.33 4 3 Netherlands Al Amerat Cricket Ground Oman Cricket (Ministry Turf 1) 2019-02-17 46 44 104.54 3 1 United Arab Emirates ICC Academy, Dubai 2021-10-07
Kevin O'Brien: best T20I bowling Figures Balls Mdns Econ Opponent Ground Date 4/45 24 0 11.25 Afghanistan Greater Noida 2017-03-12 3/8 24 0 2.00 Nepal Civil Service Cricket Club, Stormont 2015-07-13 3/14 24 0 3.50 United Arab Emirates Sheikh Zayed Stadium 2016-02-14 3/26 24 0 6.50 Netherlands Malahide Cricket Ground 2015-07-25 3/32 24 0 8.00 Hong Kong Malahide Cricket Ground 2015-07-17 3/35 24 0 8.75 Scotland Dubai International Cricket Stadium 2012-03-18 3/40 24 0 10.00 India Malahide Cricket Ground 2018-06-29 2/10 24 0 2.50 Papua New Guinea Townsville 2016-02-06 2/11 24 0 2.75 Papua New Guinea Civil Service Cricket Club, Stormont 2015-07-15 2/15 24 0 3.75 Kenya Civil Service Cricket Club, Stormont 2008-08-04
Latest T20I matches Latest T20I matches Date Opponent Bat Bowl Ground Result 2021-10-22 Namibia 25 0/15 Sharjah Cricket Stadium Namibia won by 8 wickets 2021-10-20 Sri Lanka 5 - Sheikh Zayed Stadium Sri Lanka won by 70 runs 2021-10-18 Netherlands 9 - Sheikh Zayed Stadium Ireland won by 7 wickets 2021-10-10 United Arab Emirates 54 - ICC Academy, Dubai United Arab Emirates won by 7 wickets 2021-10-08 United Arab Emirates 12 - ICC Academy, Dubai United Arab Emirates won by 54 runs 2021-10-07 United Arab Emirates 46 - ICC Academy, Dubai Ireland won by 7 wickets 2021-09-04 Zimbabwe 7 - Bready Cricket Club Zimbabwe won by 5 runs 2021-09-02 Zimbabwe 47 - Bready Cricket Club Ireland won by 64 runs 2021-09-01 Zimbabwe 9 - Bready Cricket Club Ireland won by 40 runs 2021-08-29 Zimbabwe 60 - Clontarf Cricket Club Ground Ireland won by 7 wickets
238 Runs
122.05 Strike rate
17.00 Average
0 Hundreds
0 Fifties
42* Highest
Ireland 2009 to 2021 · 18 matches
T20 World Cup career record T20 World Cup batting record Batting Mat Inns NO Runs HS Avg BF SR 100 50 0 4s 6s Career 18 16 2 238 42* 17.00 195 122.05 0 0 3 21 8
T20 World Cup bowling record Bowling Mat Inns Overs Runs Wkts BBI Avg Econ SR Dot % 4w 5w Career 18 13 32.2 248 9 2/17 27.55 7.67 21.55 36.08 0 0
T20 World Cup fielding and awards Other Ct St PoM Career 8 0 0
T20 World Cup career in charts T20 World Cup runs by season 0 20 40 60 2009: 69 runs 69 2009 2010: 9 runs 9 2010 2012: 48 runs 48 2012 2014: 59 runs 59 2014 2016: 14 runs 14 2016 2021: 39 runs 39 2021
T20 World Cup season by season T20 World Cup record by season Season Team Mat Runs HS Avg SR 50+ Wkts BBI Econ 2021 Ireland 3 39 25 13.00 105.40 0 0 0/15 6.42 2016 Ireland 3 14 14 7.00 100.00 0 2 2/25 9.33 2014 Ireland 3 59 42* 29.50 210.71 0 4 2/17 7.20 2012 Ireland 2 48 35 24.00 109.09 0 1 1/18 6.00 2010 Ireland 2 9 9 9.00 56.25 0 2 2/22 7.50 2009 Ireland 5 69 39* 17.25 123.21 0 0 0/9 8.14 Career 18 238 42* 17.00 122.05 0 9 2/17 7.67
Ball-by-ball T20 World Cup analysis Phase splits, bowler and batter matchups, dismissal patterns and every innings for Kevin O'Brien in the T20 World Cup analytics.
Open T20 World Cup analysis Make T20 World Cup stat card T20 World Cup records
Source: Cricsheet ball-by-ball data (licensed under ODC-BY 1.0 ), 378 matches to 2026-03-08. Balls faced exclude wides. Bowlers are charged wides and no-balls. Super overs are excluded. T20 World Cup matches are T20Is, so they are also counted in the T20I record.
Questions about Kevin O'Brien How many Test runs has Kevin O'Brien scored? Kevin O'Brien has 258 runs in 6 Test innings from 3 matches at an average of 51.60 and a strike rate of 55.24. Highest score: 118.
How many ODI runs has Kevin O'Brien scored? Kevin O'Brien has 3,619 runs in 141 ODI innings from 153 matches at an average of 29.42 and a strike rate of 88.78. Highest score: 142. Full answer →
What is Kevin O'Brien's ODI batting average? Kevin O'Brien's ODI batting average is 29.42, from 3,619 runs and 141 innings. Full answer →
How many ODI wickets has Kevin O'Brien taken? Kevin O'Brien has taken 114 wickets in ODI from 153 matches at a bowling average of 32.68. Best innings: 4/13. Full answer →
How many ODI sixes has Kevin O'Brien hit? Kevin O'Brien has hit 84 sixes in ODI cricket. Full answer →
How many T20I runs has Kevin O'Brien scored? Kevin O'Brien has 1,973 runs in 103 T20I innings from 110 matches at an average of 21.21 and a strike rate of 130.92. Highest score: 124. Full answer →
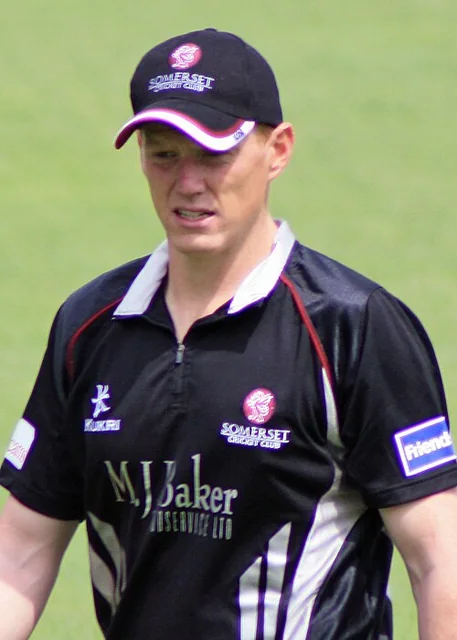

 IrelandMenMiddle-order batter2006 to 2021