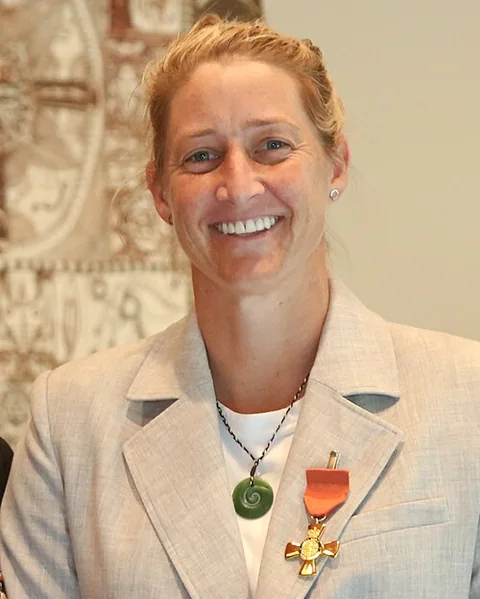
Home / Players / Sophie Devine ⓘ Photo: Government House, Department of the Prime Minister and Cabinet Wikimedia Commons ·
CC0 1.0 Resized to WebP; displayed as a portrait. Sophie Devine New Zealand Women Middle-order batter 2006 to 2026
317 Internationals 7th among women
8,096 Runs 12th among women
10 Hundreds 11th among women
241 Wickets 16th among women
93 Catches 28th among women
Overview ODI159 T20I158 Recent scores Oldest on the left. Recorded scorecards only. The top edge marks the result for their side.
Last 12 batting innings 386 Runs
35.09 Average
155.64 Strike rate
Last 12 bowling innings 12 Wickets
4/12 Best
7.43 Economy
Career records by format Batting career records by format Format Mat Inns NO Runs HS Avg BF SR 100s 50s 0s 4s 6s ODI 159 144 13 4,279 145 32.66 5,033 85.01 9 18 5 410 75 T20I 158 154 21 3,817 105 28.69 3,098 123.20 1 24 12 353 134
Bowling career records by format Format Mat Inns Balls Mdns Runs Wkts BBI BBM Avg Econ SR 4w 5w 10w ODI 159 133 5,262 55 4,027 111 3/24 3/24 36.27 4.59 47.40 0 0 - T20I 158 134 2,258 6 2,541 130 4/12 4/12 19.54 6.75 17.36 2 0 -
Fielding career records by format Format Mat Inns Ct St Dis Dis/inns Best ODI 159 157 44 0 44 0.280 2 (2ct 0st) T20I 158 157 49 0 49 0.312 3 (3ct 0st)
Runs by format
4,279 53% 3,817 47%
Wickets by format
111 46% 130 54%
Career records checked 2026-11-09. Independent of the scorecard archive.
New Zealand · Compare with another player
Innings explorer 317 scorecards Open explorer
Scorecard coverage Scorecard coverage of the official career Format Official bat inns In scorecards Official bowl inns In scorecards First Latest Coverage ODI 144 144 133 133 2006-10-22 2025-10-26 Complete T20I 154 154 134 134 2006-10-18 2026-06-27 Complete
4,279 Runs 16th among women
32.66 Average
85.01 Strike rate
9 Hundreds 9th among women
18 Fifties
145 Highest
Recent scores Oldest on the left. Recorded scorecards only. The top edge marks the result for their side.
Last 12 batting innings 490 Runs
40.83 Average
84.62 Strike rate
1 Hundreds
Last 12 bowling innings 10 Wickets
3/27 Best
5.45 Economy
Official ODI record Official ODI batting record Batting Mat Inns NO Runs HS Avg BF SR 100 50 0 4s 6s Career 159 144 13 4,279 145 32.66 5,033 85.01 9 18 5 410 75
Official ODI bowling record Bowling Mat Inns Balls Mdns Runs Wkts BBI BBM Avg Econ SR 4w 5w 10w Career 159 133 5,262 55 4,027 111 3/24 3/24 36.27 4.59 47.40 0 0 -
Official ODI fielding record Fielding Mat Inns Ct St Dis Dis/Inns Best Career 159 157 44 0 44 0.280 2 (2ct 0st)
ODI career in charts ODI batting form: average over 20 innings 20 40 60 Overall 32.7 Best spell: 58.5 up to 2020-01-25 Best 58.5 Latest: 39.7 2009 2014 2017 2020 2023 ODI runs by year 0 200 400 2006: 7 runs 2006 2007: 55 runs 2008: 131 runs 2009: 44 runs 2009 2010: 268 runs 2011: 0 runs 2012: 0 runs 2012 2013: 265 runs 2014: 206 runs 2015: 363 runs 2015 2016: 185 runs 2017: 293 runs 2018: 533 runs 2018 2019: 160 runs 2020: 150 runs 2021: 146 runs 2021 2022: 524 runs 2023: 346 runs 2024: 314 runs 2024 2025: 289 runs 2025 Last 20 ODI innings
0 1-49 50-99 100+ * not out
ODI innings by score How ODI innings ended Caught 68 · 47.2%
Bowled 31 · 21.5%
LBW 17 · 11.8%
Run out 9 · 6.2%
Stumped 4 · 2.8%
Caught and bowled 2 · 1.4%
Not out 13 · 9.0%
ODI batting position: average and innings ODI runs from boundaries Fours 1,640 · 38.3%
Sixes 450 · 10.5%
Other runs 2,189 · 51.2%
ODI bowling form: wickets per innings over 20 innings 1 Overall 0.83 Best spell: 1.10 up to 2022-02-18 Best 1.10 Latest: 0.90 2008 2014 2017 2020 2023 ODI wickets by year 0 4 8 12 2006: 3 wickets 2006 2007: 7 wickets 2008: 9 wickets 2009: 8 wickets 2009 2010: 9 wickets 2011: 0 wickets 2012: 0 wickets 2012 2013: 0 wickets 2014: 3 wickets 2015: 15 wickets 2015 2016: 1 wicket 2017: 3 wickets 2018: 6 wickets 2018 2019: 5 wickets 2020: 4 wickets 2021: 9 wickets 2021 2022: 7 wickets 2023: 12 wickets 2024: 6 wickets 2024 2025: 4 wickets 2025 Last 20 ODI bowling innings
ODI innings by wickets
ODI record by situation complete career Opposition Home and away Batting first or chasing Batting position Match result Year Ground Series and tournaments Bowling first or defending
Sophie Devine: ODI batting by opposition Mat Inns NO Runs HS Avg BF SR 100 50 0 4s 6s Australia 37 37 6 775 112 25.00 1,096 70.71 1 4 1 67 8 England 36 36 3 857 117* 25.96 1,136 75.44 2 2 3 88 10 India 19 19 1 483 89 26.83 624 77.40 0 2 1 49 9 West Indies 18 18 1 679 108 39.94 770 88.18 2 3 0 56 10 Pakistan 11 11 0 481 103 43.72 401 119.95 1 4 0 43 19 South Africa 9 9 0 430 145 47.77 475 90.52 1 2 0 47 7 Sri Lanka 7 7 2 301 137 60.20 280 107.50 1 0 0 37 4 Bangladesh 5 5 0 141 63 28.20 166 84.93 0 1 0 10 2 Ireland 2 2 0 132 108 66.00 85 155.29 1 0 0 13 6 All 159 144 13 4,279 145 32.66 5,033 85.01 9 18 5 410 75
Sophie Devine: ODI bowling by opposition Mat Inns Balls Mdns Runs Wkts BBI Avg Econ SR 4w 5w Australia 39 39 1,851 25 1,422 30 3/32 47.40 4.60 61.70 0 0 England 31 31 1,270 9 1,035 27 3/38 38.33 4.88 47.03 0 0 India 18 18 598 5 465 15 3/27 31.00 4.66 39.86 0 0 West Indies 15 15 549 3 411 11 3/24 37.36 4.49 49.90 0 0 Sri Lanka 10 10 426 10 276 13 3/54 21.23 3.88 32.76 0 0 South Africa 9 9 299 1 229 8 3/33 28.62 4.59 37.37 0 0 Pakistan 7 7 179 1 138 6 3/25 23.00 4.62 29.83 0 0 Bangladesh 3 3 60 1 26 0 0/3 N/A 2.60 N/A 0 0 Ireland 1 1 30 0 25 1 1/25 25.00 5.00 30.00 0 0 All 159 133 5,262 55 4,027 111 3/24 36.27 4.59 47.40 0 0
Sophie Devine: ODI batting by home and away Mat Inns NO Runs HS Avg BF SR 100 50 0 4s 6s Home 62 62 6 1,809 108 32.30 2,001 90.40 3 8 2 175 24 Away 59 59 6 1,617 137 30.50 2,080 77.74 3 6 1 155 30 Neutral 23 23 1 853 145 38.77 952 89.60 3 4 2 80 21 All 159 144 13 4,279 145 32.66 5,033 85.01 9 18 5 410 75
Sophie Devine: ODI bowling by home and away Mat Inns Balls Mdns Runs Wkts BBI Avg Econ SR 4w 5w Home 57 57 2,230 28 1,640 45 3/24 36.44 4.41 49.55 0 0 Away 58 58 2,385 24 1,865 52 3/27 35.86 4.69 45.86 0 0 Neutral 18 18 647 3 522 14 3/38 37.28 4.84 46.21 0 0 All 159 133 5,262 55 4,027 111 3/24 36.27 4.59 47.40 0 0
Sophie Devine: ODI batting by batting first or chasing Mat Inns NO Runs HS Avg BF SR 100 50 0 4s 6s Batting first 83 83 8 2,675 145 35.66 3,094 86.45 5 13 2 252 45 Chasing 61 61 5 1,604 117* 28.64 1,939 82.72 4 5 3 158 30 All 159 144 13 4,279 145 32.66 5,033 85.01 9 18 5 410 75
Sophie Devine: ODI bowling by bowling first or defending Mat Inns Balls Mdns Runs Wkts BBI Avg Econ SR 4w 5w Bowling first 62 62 2,635 26 2,024 62 3/25 32.64 4.60 42.50 0 0 Defending a total 71 71 2,627 29 2,003 49 3/24 40.87 4.57 53.61 0 0 All 159 133 5,262 55 4,027 111 3/24 36.27 4.59 47.40 0 0
Sophie Devine: ODI batting by batting position Mat Inns NO Runs HS Avg BF SR 100 50 0 4s 6s No. 1 13 13 0 471 108 36.23 462 101.94 2 1 1 54 6 No. 2 21 21 1 915 117* 45.75 1,040 87.98 3 4 1 93 10 No. 3 8 8 0 220 93 27.50 184 119.56 0 2 0 24 11 No. 4 40 40 4 1,386 145 38.50 1,568 88.39 4 4 0 133 32 No. 5 27 27 1 783 89 30.11 1,086 72.09 0 5 0 67 10 No. 6 3 3 0 113 50 37.66 137 82.48 0 1 0 7 3 No. 7 5 5 1 123 74* 30.75 153 80.39 0 1 1 10 2 No. 8 9 9 1 81 23 10.12 152 53.28 0 0 1 5 0 No. 9 8 8 1 111 30 15.85 153 72.54 0 0 0 12 1 No. 10 7 7 2 58 16 11.60 55 105.45 0 0 1 4 0 No. 11 3 3 2 18 9 18.00 43 41.86 0 0 0 1 0 All 159 144 13 4,279 145 32.66 5,033 85.01 9 18 5 410 75
Sophie Devine: ODI batting by match result Mat Inns NO Runs HS Avg BF SR 100 50 0 4s 6s Won 52 52 7 2,074 145 46.08 2,012 103.08 7 8 1 206 50 Lost 88 88 6 2,121 112 25.86 2,935 72.26 2 10 4 195 25 Tied 1 1 0 29 29 29.00 32 90.62 0 0 0 4 0 No result 3 3 0 55 42 18.33 54 101.85 0 0 0 5 0 All 159 144 13 4,279 145 32.66 5,033 85.01 9 18 5 410 75
Sophie Devine: ODI bowling by match result Mat Inns Balls Mdns Runs Wkts BBI Avg Econ SR 4w 5w Won 52 52 2,024 27 1,320 62 3/24 21.29 3.91 32.64 0 0 Lost 77 77 3,106 26 2,594 45 3/32 57.64 5.01 69.02 0 0 Tied 1 1 42 0 39 1 1/39 39.00 5.57 42.00 0 0 No result 3 3 90 2 74 3 3/54 24.66 4.93 30.00 0 0 All 159 133 5,262 55 4,027 111 3/24 36.27 4.59 47.40 0 0
Sophie Devine: ODI batting by year Mat Inns NO Runs HS Avg BF SR 100 50 0 4s 6s 2006 2 2 1 7 6* 7.00 35 20.00 0 0 0 0 0 2007 6 6 3 55 30 18.33 99 55.55 0 0 0 7 0 2008 9 9 2 131 40 18.71 102 128.43 0 0 1 10 2 2009 7 7 0 44 17 6.28 60 73.33 0 0 2 5 0 2010 12 12 1 268 74* 24.36 409 65.52 0 2 0 17 4 2013 9 9 1 265 145 33.12 306 86.60 1 0 0 24 9 2014 5 5 0 206 89 41.20 251 82.07 0 1 0 16 6 2015 12 12 0 363 89 30.25 520 69.80 0 2 0 36 5 2016 6 6 0 185 67 30.83 236 78.38 0 2 0 16 3 2017 8 8 0 293 103 36.62 277 105.77 1 2 0 27 9 2018 7 7 2 533 117* 106.60 485 109.89 3 2 0 52 10 2019 6 6 1 160 58 32.00 224 71.42 0 1 0 11 4 2020 6 6 0 150 79 25.00 226 66.37 0 1 1 13 0 2021 8 8 0 146 41 18.25 226 64.60 0 0 0 15 1 2022 18 18 0 524 108 29.11 571 91.76 1 1 1 61 3 2023 9 9 1 346 137 43.25 320 108.12 1 1 0 35 9 2024 9 9 1 314 100* 39.25 347 90.48 1 1 0 40 5 2025 5 5 0 289 112 57.80 339 85.25 1 2 0 25 5 All 159 144 13 4,279 145 32.66 5,033 85.01 9 18 5 410 75
Sophie Devine: ODI bowling by year Mat Inns Balls Mdns Runs Wkts BBI Avg Econ SR 4w 5w 2006 3 3 131 1 92 3 2/32 30.66 4.21 43.66 0 0 2007 8 8 396 5 300 7 3/38 42.85 4.54 56.57 0 0 2008 9 9 444 5 319 9 2/20 35.44 4.31 49.33 0 0 2009 9 9 430 6 281 8 2/19 35.12 3.92 53.75 0 0 2010 13 13 530 5 429 9 2/34 47.66 4.85 58.88 0 0 2014 6 6 216 2 156 3 2/43 52.00 4.33 72.00 0 0 2015 15 15 621 17 392 15 3/40 26.13 3.78 41.40 0 0 2016 5 5 150 2 121 1 1/47 121.00 4.84 150.00 0 0 2017 4 4 161 2 110 3 1/10 36.66 4.09 53.66 0 0 2018 6 6 227 0 198 6 3/24 33.00 5.23 37.83 0 0 2019 6 6 228 1 155 5 3/32 31.00 4.07 45.60 0 0 2020 6 6 245 4 194 4 2/50 48.50 4.75 61.25 0 0 2021 7 7 342 2 297 9 2/26 33.00 5.21 38.00 0 0 2022 12 12 340 1 271 7 2/42 38.71 4.78 48.57 0 0 2023 9 9 294 0 244 12 3/25 20.33 4.97 24.50 0 0 2024 8 8 301 1 267 6 3/27 44.50 5.32 50.16 0 0 2025 7 7 206 1 201 4 3/54 50.25 5.85 51.50 0 0 All 159 133 5,262 55 4,027 111 3/24 36.27 4.59 47.40 0 0
Sophie Devine: ODI batting by ground Mat Inns NO Runs HS Avg BF SR 100 50 0 4s 6s Lincoln 13 13 2 285 58 25.90 281 101.42 0 1 1 28 2 Seddon Park 8 8 2 331 100* 55.16 338 97.92 1 1 0 37 6 Bay Oval 7 7 0 220 108 31.42 327 67.27 1 1 0 17 0 Queenstown Events Centre 7 7 1 256 74* 42.66 230 111.30 0 2 1 22 9 Hagley Oval 6 6 1 162 73* 32.40 163 99.38 0 1 0 18 1 The County Ground 6 6 0 167 93 27.83 138 121.01 0 1 0 17 10 M Chinnaswamy Stadium 5 5 0 181 89 36.20 279 64.87 0 1 0 16 5 Basin Reserve 4 4 0 67 25 16.75 91 73.62 0 0 0 9 0 Bert Sutcliffe Oval 4 4 0 245 108 61.25 243 100.82 1 1 0 20 3 Marrara Cricket Ground 4 4 3 15 11* 15.00 20 75.00 0 0 0 0 0 Warner Park 4 4 0 161 89 40.25 211 76.30 0 1 0 10 6 Allan Border Field 3 3 0 90 79 30.00 139 64.74 0 1 1 8 0 Brabourne Stadium 3 3 0 34 17 11.33 65 52.30 0 0 0 4 0 County Ground, Bristol 3 3 0 91 43 30.33 132 68.93 0 0 0 10 0 Galle International Stadium 3 3 1 194 137 97.00 183 106.01 1 0 0 20 3 All 159 144 13 4,279 145 32.66 5,033 85.01 9 18 5 410 75
Sophie Devine: ODI bowling by ground Mat Inns Balls Mdns Runs Wkts BBI Avg Econ SR 4w 5w Lincoln 15 15 720 10 501 15 2/20 33.40 4.17 48.00 0 0 Bay Oval 8 8 276 4 229 4 2/30 57.25 4.97 69.00 0 0 Queenstown Events Centre 7 7 222 2 200 7 2/42 28.57 5.40 31.71 0 0 Bert Sutcliffe Oval 5 5 186 3 128 3 2/17 42.66 4.12 62.00 0 0 M Chinnaswamy Stadium 5 5 189 5 128 5 3/40 25.60 4.06 37.80 0 0 Marrara Cricket Ground 5 5 288 5 174 4 2/21 43.50 3.62 72.00 0 0 Seddon Park 5 5 186 1 141 2 1/19 70.50 4.54 93.00 0 0 County Ground, Bristol 4 4 190 1 151 3 2/57 50.33 4.76 63.33 0 0 Hagley Oval 4 4 173 3 108 9 3/24 12.00 3.74 19.22 0 0 The County Ground 4 4 167 1 126 6 2/26 21.00 4.52 27.83 0 0 Warner Park 4 4 120 1 93 0 0/5 N/A 4.65 N/A 0 0 Allan Border Field 3 3 138 3 125 2 2/50 62.50 5.43 69.00 0 0 Basin Reserve 3 3 138 1 108 2 2/49 54.00 4.69 69.00 0 0 Brisbane Cricket Ground 3 3 131 1 92 3 2/32 30.66 4.21 43.66 0 0 Galle International Stadium 3 3 78 0 67 3 1/15 22.33 5.15 26.00 0 0 All 159 133 5,262 55 4,027 111 3/24 36.27 4.59 47.40 0 0
Sophie Devine: ODI batting by series and tournaments Mat Inns NO Runs HS Avg BF SR 100 50 0 4s 6s ICC Women's World Cup 20 20 0 758 112 37.90 849 89.28 2 4 0 75 16 ICC Women's Championship 16 16 3 934 137 71.84 970 96.28 4 5 0 92 8 New Zealand Women tour of England 8 8 0 193 43 24.12 259 74.51 0 0 0 27 1 India Women tour of New Zealand 5 5 0 112 34 22.40 112 100.00 0 0 1 13 1 England Women tour of New Zealand 4 4 1 137 100* 45.66 151 90.72 1 0 0 14 4 Bangladesh Women tour of New Zealand 3 3 0 64 42 21.33 65 98.46 0 0 0 7 0 India in New Zealand ODI Series 3 3 1 52 28 26.00 68 76.47 0 0 0 3 2 New Zealand Women tour of Australia 3 3 0 90 79 30.00 139 64.74 0 1 1 8 0 New Zealand Women tour of India 3 3 0 90 79 30.00 102 88.23 0 1 0 9 1 New Zealand Women tour of South Africa 3 3 0 47 30 15.66 58 81.03 0 0 0 8 0 New Zealand Women tour of West Indies 3 3 0 39 25 13.00 56 69.64 0 0 0 4 0 Pakistan Women tour of New Zealand 3 3 0 105 70 35.00 79 132.91 0 1 0 7 6 All 159 144 13 4,279 145 32.66 5,033 85.01 9 18 5 410 75
Sophie Devine: ODI bowling by series and tournaments Mat Inns Balls Mdns Runs Wkts BBI Avg Econ SR 4w 5w ICC Women's Championship 14 14 467 4 363 11 3/24 33.00 4.66 42.45 0 0 ICC Women's World Cup 13 13 433 3 371 8 3/54 46.37 5.14 54.12 0 0 New Zealand Women tour of England 8 8 334 2 312 7 2/29 44.57 5.60 47.71 0 0 India Women tour of New Zealand 5 5 132 0 118 4 2/42 29.50 5.36 33.00 0 0 India in New Zealand ODI Series 3 3 66 0 49 0 0/8 N/A 4.45 N/A 0 0 New Zealand Women tour of Australia 3 3 138 3 125 2 2/50 62.50 5.43 69.00 0 0 New Zealand Women tour of India 3 3 123 0 101 4 3/27 25.25 4.92 30.75 0 0 New Zealand Women tour of South Africa 3 3 108 0 94 4 3/33 23.50 5.22 27.00 0 0 New Zealand Women tour of West Indies 3 3 88 0 70 2 1/21 35.00 4.77 44.00 0 0 Pakistan Women tour of New Zealand 3 3 108 0 83 5 3/25 16.60 4.61 21.60 0 0 Rose Bowl 3 3 162 1 106 5 3/32 21.20 3.92 32.40 0 0 South Africa Women in New Zealand ODI Series 3 3 107 1 69 2 1/16 34.50 3.86 53.50 0 0 All 159 133 5,262 55 4,027 111 3/24 36.27 4.59 47.40 0 0
Sophie Devine: ODI batting by batting first or chasing Mat Inns NO Runs HS Avg BF SR 100 50 0 4s 6s Batting first 83 83 8 2,675 145 35.66 3,094 86.45 5 13 2 252 45 Chasing 61 61 5 1,604 117* 28.64 1,939 82.72 4 5 3 158 30 All 159 144 13 4,279 145 32.66 5,033 85.01 9 18 5 410 75
Sophie Devine: ODI bowling by bowling first or defending Mat Inns Balls Mdns Runs Wkts BBI Avg Econ SR 4w 5w Bowling first 62 62 2,635 26 2,024 62 3/25 32.64 4.60 42.50 0 0 Defending a total 71 71 2,627 29 2,003 49 3/24 40.87 4.57 53.61 0 0 All 159 133 5,262 55 4,027 111 3/24 36.27 4.59 47.40 0 0
- not recorded in the scorecards · N/A no dismissals or balls to divide by
Best ODI performances Sophie Devine: highest ODI scores Score BF SR 4s 6s Opponent Ground Date 145 131 110.68 13 6 South Africa Barabati Stadium 2013-02-01 137 121 113.22 17 2 Sri Lanka Galle International Stadium 2023-06-30 117* 116 100.86 12 2 England Grace Road 2018-07-13 112 112 100.00 12 3 Australia Holkar Cricket Stadium 2025-10-01 108 103 104.85 8 2 West Indies Bert Sutcliffe Oval 2018-03-04 108 61 177.04 13 6 Ireland The Hills Cricket Club Ground 2018-06-10 108 127 85.03 10 0 West Indies Bay Oval 2022-03-04 103 119 86.55 10 0 Pakistan Sharjah Cricket Stadium 2017-10-31 100* 93 107.52 11 4 England Seddon Park 2024-04-07 93 41 226.82 7 9 Pakistan The County Ground 2017-07-08
Sophie Devine: best ODI bowling Figures Balls Mdns Econ Opponent Ground Date 3/24 35 0 4.11 West Indies Hagley Oval 2018-03-11 3/25 36 0 4.16 Pakistan Hagley Oval 2023-12-15 3/27 43 0 3.76 India Narendra Modi Stadium 2024-10-27 3/32 60 0 3.20 Australia WACA 2019-02-22 3/33 54 0 3.66 South Africa Kingsmead 2023-10-01 3/38 48 0 4.75 England MA Chidambaram Stadium 2007-03-03 3/40 60 2 4.00 India M Chinnaswamy Stadium 2015-07-03 3/54 54 1 6.00 Sri Lanka R Premadasa Stadium 2025-10-14 2/17 60 2 1.70 Sri Lanka Bert Sutcliffe Oval 2015-11-05 2/19 42 2 2.71 Australia North Sydney Oval 2009-03-08
Latest ODI matches Latest ODI matches Date Opponent Bat Bowl Ground Result 2025-10-26 England 23 1/20 Andhra Cricket Association-Visakhapatnam District Cricket Association Stadium England won by 8 wickets 2025-10-23 India 6 0/34 Dr DY Patil Sports Academy India won by 53 runs (D/L method) 2025-10-18 Pakistan did not bat 0/10 R Premadasa Stadium No result 2025-10-14 Sri Lanka did not bat 3/54 R Premadasa Stadium No result 2025-10-10 Bangladesh 63 0/3 Barsapara Cricket Stadium New Zealand won by 100 runs 2025-10-06 South Africa 85 0/25 Holkar Cricket Stadium South Africa won by 6 wickets 2025-10-01 Australia 112 0/55 Holkar Cricket Stadium Australia won by 89 runs 2024-12-23 Australia 25 2/49 Basin Reserve Australia won by 75 runs 2024-12-21 Australia 15 0/46 Basin Reserve Australia won by 65 runs (D/L method) 2024-10-29 India 9 1/44 Narendra Modi Stadium India won by 6 wickets
3,817 Runs 6th among women
28.69 Bat avg
123.20 Strike rate
130 Wickets 14th among women
19.54 Bowl avg
6.75 Economy
Recent scores Oldest on the left. Recorded scorecards only. The top edge marks the result for their side.
Last 12 batting innings 386 Runs
35.09 Average
155.64 Strike rate
Last 12 bowling innings 12 Wickets
4/12 Best
7.79 Economy
Official T20I record Official T20I batting record Batting Mat Inns NO Runs HS Avg BF SR 100 50 0 4s 6s Career 158 154 21 3,817 105 28.69 3,098 123.20 1 24 12 353 134
Official T20I bowling record Bowling Mat Inns Balls Mdns Runs Wkts BBI BBM Avg Econ SR 4w 5w 10w Career 158 134 2,258 6 2,541 130 4/12 4/12 19.54 6.75 17.36 2 0 -
Official T20I fielding record Fielding Mat Inns Ct St Dis Dis/Inns Best Career 158 157 49 0 49 0.312 3 (3ct 0st)
T20I career in charts T20I batting form: average over 20 innings 20 40 60 Overall 28.7 Best spell: 53.5 up to 2020-02-22 Best 53.5 Latest: 28.4 2010 2014 2017 2020 2023 2026 T20I runs by year 0 200 400 2006: 0 runs 2006 2007: 0 runs 2008: 1 run 2009: 72 runs 2009 2010: 262 runs 2011: 0 runs 2012: 104 runs 2012 2013: 104 runs 2014: 253 runs 2015: 237 runs 2015 2016: 138 runs 2017: 158 runs 2018: 473 runs 2018 2019: 153 runs 2020: 492 runs 2021: 114 runs 2021 2022: 389 runs 2023: 157 runs 2024: 284 runs 2024 2025: 40 runs 2026: 386 runs 2026 Last 20 T20I innings
0 1-49 50-99 100+ * not out
T20I innings by score How T20I innings ended Caught 79 · 51.3%
Bowled 23 · 14.9%
LBW 10 · 6.5%
Run out 11 · 7.1%
Stumped 7 · 4.5%
Caught and bowled 3 · 1.9%
Not out 21 · 13.6%
T20I batting position: average and innings T20I runs from boundaries Fours 1,412 · 37.0%
Sixes 804 · 21.1%
Other runs 1,601 · 41.9%
T20I bowling form: wickets per innings over 20 innings 1 Overall 0.97 Best spell: 1.40 up to 2016-03-31 Best 1.40 Latest: 0.65 2010 2015 2018 2021 2024 T20I wickets by year 0 5 10 15 2006: 1 wicket 2006 2007: 1 wicket 2008: 1 wicket 2009: 5 wickets 2009 2010: 16 wickets 2011: 0 wickets 2012: 3 wickets 2012 2013: 0 wickets 2014: 13 wickets 2015: 7 wickets 2015 2016: 10 wickets 2017: 2 wickets 2018: 17 wickets 2018 2019: 4 wickets 2020: 11 wickets 2021: 6 wickets 2021 2022: 13 wickets 2023: 3 wickets 2024: 4 wickets 2024 2025: 2 wickets 2026: 11 wickets 2026 Last 20 T20I bowling innings
T20I innings by wickets
T20I record by situation complete career Opposition Home and away Batting first or chasing Batting position Match result Year Ground Series and tournaments Bowling first or defending
Sophie Devine: T20I batting by opposition Mat Inns NO Runs HS Avg BF SR 100 50 0 4s 6s Australia 33 33 5 563 53 20.10 545 103.30 0 1 4 57 12 England 32 32 3 730 87 25.17 604 120.86 0 6 4 62 29 West Indies 23 23 1 437 46 19.86 431 101.39 0 0 0 40 11 South Africa 20 20 5 861 105 57.40 616 139.77 1 9 1 77 37 Sri Lanka 15 15 5 315 75* 31.50 249 126.50 0 2 2 20 13 India 12 12 2 383 72 38.30 259 147.87 0 4 0 37 18 Pakistan 11 11 0 306 70 27.81 237 129.11 0 1 0 33 9 Bangladesh 5 5 0 123 47 24.60 97 126.80 0 0 1 17 0 Ireland 2 2 0 98 51 49.00 56 175.00 0 1 0 10 5 Scotland 1 1 0 1 1 1.00 4 25.00 0 0 0 0 0 All 158 154 21 3,817 105 28.69 3,098 123.20 1 24 12 353 134
Sophie Devine: T20I bowling by opposition Mat Inns Balls Mdns Runs Wkts BBI Avg Econ SR 4w 5w Australia 30 30 573 2 649 31 3/18 20.93 6.79 18.48 0 0 England 27 27 436 0 560 18 3/26 31.11 7.70 24.22 0 0 West Indies 21 21 363 2 336 26 4/22 12.92 5.55 13.96 1 0 South Africa 17 17 305 0 393 24 4/12 16.37 7.73 12.70 1 0 Sri Lanka 13 13 172 0 198 6 2/18 33.00 6.90 28.66 0 0 India 11 11 199 0 205 13 2/13 15.76 6.18 15.30 0 0 Pakistan 8 8 96 1 108 6 2/23 18.00 6.75 16.00 0 0 Bangladesh 4 4 54 0 50 2 1/14 25.00 5.55 27.00 0 0 Ireland 2 2 42 1 23 2 1/4 11.50 3.28 21.00 0 0 Scotland 1 1 18 0 19 2 2/19 9.50 6.33 9.00 0 0 All 158 134 2,258 6 2,541 130 4/12 19.54 6.75 17.36 2 0
Sophie Devine: T20I batting by home and away Mat Inns NO Runs HS Avg BF SR 100 50 0 4s 6s Home 46 46 7 1,287 105 33.00 976 131.86 1 9 4 122 44 Away 62 62 6 1,322 87 23.60 1,146 115.35 0 7 4 117 54 Neutral 46 46 8 1,208 75* 31.78 976 123.77 0 8 4 114 36 All 158 154 21 3,817 105 28.69 3,098 123.20 1 24 12 353 134
Sophie Devine: T20I bowling by home and away Mat Inns Balls Mdns Runs Wkts BBI Avg Econ SR 4w 5w Home 45 45 742 2 847 51 4/12 16.60 6.84 14.54 1 0 Away 54 54 914 2 1,029 42 3/18 24.50 6.75 21.76 0 0 Neutral 35 35 602 2 665 37 4/22 17.97 6.62 16.27 1 0 All 158 134 2,258 6 2,541 130 4/12 19.54 6.75 17.36 2 0
Sophie Devine: T20I batting by batting first or chasing Mat Inns NO Runs HS Avg BF SR 100 50 0 4s 6s Batting first 88 88 6 2,377 105 28.98 1,935 122.84 1 13 5 213 78 Chasing 66 66 15 1,440 75* 28.23 1,163 123.81 0 11 7 140 56 All 158 154 21 3,817 105 28.69 3,098 123.20 1 24 12 353 134
Sophie Devine: T20I bowling by bowling first or defending Mat Inns Balls Mdns Runs Wkts BBI Avg Econ SR 4w 5w Bowling first 60 60 1,026 2 1,205 58 4/22 20.77 7.04 17.68 1 0 Defending a total 74 74 1,232 4 1,336 72 4/12 18.55 6.50 17.11 1 0 All 158 134 2,258 6 2,541 130 4/12 19.54 6.75 17.36 2 0
Sophie Devine: T20I batting by batting position Mat Inns NO Runs HS Avg BF SR 100 50 0 4s 6s No. 1 38 38 2 1,159 105 32.19 933 124.22 1 7 1 117 38 No. 2 24 24 2 782 77 35.54 621 125.92 0 7 2 78 29 No. 3 26 26 3 561 70 24.39 477 117.61 0 3 1 48 26 No. 4 51 51 10 1,127 87 27.48 895 125.92 0 7 6 97 36 No. 5 7 7 1 134 37 22.33 126 106.34 0 0 1 9 3 No. 7 4 4 1 36 14* 12.00 29 124.13 0 0 0 2 2 No. 8 2 2 1 4 4* 4.00 3 133.33 0 0 1 1 0 No. 9 1 1 0 10 10 10.00 6 166.66 0 0 0 1 0 No. 10 1 1 1 4 4* N/A 8 50.00 0 0 0 0 0 All 158 154 21 3,817 105 28.69 3,098 123.20 1 24 12 353 134
Sophie Devine: T20I batting by match result Mat Inns NO Runs HS Avg BF SR 100 50 0 4s 6s Won 87 87 18 2,613 105 37.86 1,943 134.48 1 20 4 237 99 Lost 63 63 3 1,159 77 19.31 1,084 106.91 0 4 7 112 34 Tied 3 3 0 43 30 14.33 66 65.15 0 0 1 4 1 No result 1 1 0 2 2 2.00 5 40.00 0 0 0 0 0 All 158 154 21 3,817 105 28.69 3,098 123.20 1 24 12 353 134
Sophie Devine: T20I bowling by match result Mat Inns Balls Mdns Runs Wkts BBI Avg Econ SR 4w 5w Won 76 76 1,295 5 1,324 81 4/12 16.34 6.13 15.98 1 0 Lost 54 54 903 1 1,151 45 4/22 25.57 7.64 20.06 1 0 Tied 3 3 54 0 63 4 3/29 15.75 7.00 13.50 0 0 No result 1 1 6 0 3 0 0/3 N/A 3.00 N/A 0 0 All 158 134 2,258 6 2,541 130 4/12 19.54 6.75 17.36 2 0
Sophie Devine: T20I batting by year Mat Inns NO Runs HS Avg BF SR 100 50 0 4s 6s 2006 1 1 0 0 0 0.00 0 N/A 0 0 1 0 0 2008 1 1 0 1 1 1.00 4 25.00 0 0 0 0 0 2009 6 6 2 72 23 18.00 56 128.57 0 0 0 5 2 2010 13 13 1 262 48 21.83 228 114.91 0 0 0 22 6 2012 4 4 0 104 59 26.00 105 99.04 0 1 0 9 4 2013 6 6 1 104 39 20.80 113 92.03 0 0 0 9 2 2014 10 10 1 253 46 28.11 264 95.83 0 0 1 27 3 2015 9 9 2 237 70 33.85 147 161.22 0 2 1 15 16 2016 7 7 2 138 47 27.60 104 132.69 0 0 0 17 3 2017 4 4 0 158 70 39.50 97 162.88 0 1 0 15 8 2018 16 16 1 473 73 31.53 328 144.20 0 4 1 48 21 2019 3 3 0 153 72 51.00 116 131.89 0 2 0 17 4 2020 11 11 2 492 105 54.66 389 126.47 1 4 0 41 21 2021 7 7 0 114 50 16.28 121 94.21 0 1 1 9 4 2022 14 14 1 389 53 29.92 346 112.42 0 2 0 42 9 2023 12 12 3 157 61* 17.44 133 118.04 0 1 3 11 6 2024 15 15 3 284 60 23.66 253 112.25 0 3 1 28 5 2025 3 3 1 40 39* 20.00 46 86.95 0 0 1 5 0 2026 12 12 1 386 87 35.09 248 155.64 0 3 2 33 20 All 158 154 21 3,817 105 28.69 3,098 123.20 1 24 12 353 134
Sophie Devine: T20I bowling by year Mat Inns Balls Mdns Runs Wkts BBI Avg Econ SR 4w 5w 2006 1 1 24 0 27 1 1/27 27.00 6.75 24.00 0 0 2007 1 1 24 0 30 1 1/30 30.00 7.50 24.00 0 0 2008 1 1 24 0 20 1 1/20 20.00 5.00 24.00 0 0 2009 7 7 126 1 99 5 1/9 19.80 4.71 25.20 0 0 2010 13 13 258 1 260 16 3/24 16.25 6.04 16.12 0 0 2012 4 4 44 0 51 3 2/25 17.00 6.95 14.66 0 0 2014 10 10 178 1 165 13 3/9 12.69 5.56 13.69 0 0 2015 6 6 132 0 133 7 2/13 19.00 6.04 18.85 0 0 2016 7 7 120 0 117 10 4/22 11.70 5.85 12.00 1 0 2017 3 3 42 0 46 2 1/17 23.00 6.57 21.00 0 0 2018 15 15 282 3 331 17 3/12 19.47 7.04 16.58 0 0 2019 3 3 55 0 61 4 2/21 15.25 6.65 13.75 0 0 2020 11 11 179 0 214 11 3/18 19.45 7.17 16.27 0 0 2021 7 7 132 0 158 6 3/30 26.33 7.18 22.00 0 0 2022 14 14 195 0 208 13 3/29 16.00 6.40 15.00 0 0 2023 7 7 90 0 115 3 2/23 38.33 7.66 30.00 0 0 2024 10 10 122 0 188 4 2/23 47.00 9.24 30.50 0 0 2025 3 3 48 0 79 2 1/30 39.50 9.87 24.00 0 0 2026 11 11 183 0 239 11 4/12 21.72 7.83 16.63 1 0 All 158 134 2,258 6 2,541 130 4/12 19.54 6.75 17.36 2 0
Sophie Devine: T20I batting by ground Mat Inns NO Runs HS Avg BF SR 100 50 0 4s 6s The County Ground 9 9 0 258 73 28.66 190 135.78 0 2 1 19 16 Bay Oval 7 7 2 120 54* 24.00 91 131.86 0 1 1 11 6 Sharjah Cricket Stadium 7 7 1 190 70 31.66 132 143.93 0 1 0 16 9 Allan Border Field 5 5 0 69 29 13.80 76 90.78 0 0 0 6 2 Edgbaston 5 5 1 177 53 44.25 153 115.68 0 2 0 19 5 Kensington Oval 5 5 1 91 38* 22.75 106 85.84 0 0 0 4 2 Saxton Oval 5 5 1 106 60 26.50 82 129.26 0 1 0 10 2 Seddon Park 5 5 0 190 72 38.00 141 134.75 0 2 0 19 9 Sir Vivian Richards Stadium 5 5 0 70 23 14.00 89 78.65 0 0 0 5 2 Brisbane Cricket Ground 4 4 1 25 11 8.33 26 96.15 0 0 1 2 1 M Chinnaswamy Stadium 4 4 1 129 70 43.00 59 218.64 0 1 0 12 11 Providence Stadium 4 4 0 92 51 23.00 66 139.39 0 1 1 9 5 Sky Stadium 4 4 0 11 8 2.75 27 40.74 0 0 1 1 0 The Rose Bowl 4 4 0 72 45 18.00 57 126.31 0 0 1 7 1 Arnos Vale Ground 3 3 0 62 30 20.66 88 70.45 0 0 0 7 1 All 158 154 21 3,817 105 28.69 3,098 123.20 1 24 12 353 134
Sophie Devine: T20I bowling by ground Mat Inns Balls Mdns Runs Wkts BBI Avg Econ SR 4w 5w The County Ground 8 8 144 0 189 6 2/28 31.50 7.87 24.00 0 0 Bay Oval 7 7 130 2 128 13 4/12 9.84 5.90 10.00 1 0 Allan Border Field 5 5 90 1 104 5 3/18 20.80 6.93 18.00 0 0 Edgbaston 5 5 81 0 89 6 3/37 14.83 6.59 13.50 0 0 Seddon Park 5 5 102 0 130 4 2/21 32.50 7.64 25.50 0 0 Sir Vivian Richards Stadium 5 5 66 0 62 5 3/29 12.40 5.63 13.20 0 0 Brisbane Cricket Ground 4 4 66 1 55 3 1/9 18.33 5.00 22.00 0 0 M Chinnaswamy Stadium 4 4 84 0 78 8 3/16 9.75 5.57 10.50 0 0 Providence Stadium 4 4 66 1 76 4 2/37 19.00 6.90 16.50 0 0 Saxton Oval 4 4 66 0 85 5 2/23 17.00 7.72 13.20 0 0 Sharjah Cricket Stadium 4 4 54 0 64 2 1/17 32.00 7.11 27.00 0 0 Sky Stadium 4 4 66 0 85 4 3/30 21.25 7.72 16.50 0 0 The Rose Bowl 4 4 75 0 105 0 0/18 N/A 8.40 N/A 0 0 Arnos Vale Ground 3 3 42 0 44 3 2/13 14.66 6.28 14.00 0 0 Basin Reserve 3 3 35 0 52 3 2/38 17.33 8.91 11.66 0 0 All 158 134 2,258 6 2,541 130 4/12 19.54 6.75 17.36 2 0
Sophie Devine: T20I batting by series and tournaments Mat Inns NO Runs HS Avg BF SR 100 50 0 4s 6s ICC Women's T20 World Cup 22 22 4 455 75* 25.27 393 115.77 0 3 3 37 13 New Zealand Women tour of England 11 11 1 303 87 30.30 244 124.18 0 3 2 26 16 South Africa Women tour of New Zealand 9 9 2 453 105 64.71 298 152.01 1 5 1 41 22 New Zealand Women tour of Australia 8 8 0 127 43 15.87 134 94.77 0 0 0 13 3 Women's World T20 8 8 1 204 47 29.14 167 122.15 0 0 1 26 3 ICC Women's World Twenty20 7 7 2 183 59 36.60 170 107.64 0 1 0 11 7 Commonwealth Games Women's Cricket Competition 5 5 1 177 53 44.25 153 115.68 0 2 0 19 5 England Tri-Nation T20 Women's Series 5 5 1 237 73 59.25 158 150.00 0 3 0 23 10 England Women tour of New Zealand 5 5 0 87 60 17.40 69 126.08 0 1 1 8 2 New Zealand Women tour of West Indies 5 5 0 70 23 14.00 89 78.65 0 0 0 5 2 Australia Women tour of New Zealand 4 4 1 57 39* 19.00 68 83.82 0 0 1 8 0 India Women tour of New Zealand 4 4 0 184 72 46.00 139 132.37 0 2 0 19 6 All 158 154 21 3,817 105 28.69 3,098 123.20 1 24 12 353 134
Sophie Devine: T20I bowling by series and tournaments Mat Inns Balls Mdns Runs Wkts BBI Avg Econ SR 4w 5w ICC Women's T20 World Cup 13 13 207 1 254 9 2/19 28.22 7.36 23.00 0 0 New Zealand Women tour of England 10 10 158 0 218 3 2/28 72.66 8.27 52.66 0 0 South Africa Women tour of New Zealand 9 9 149 0 187 13 4/12 14.38 7.53 11.46 1 0 ICC Women's World Twenty20 7 7 104 0 101 6 2/21 16.83 5.82 17.33 0 0 New Zealand Women tour of Australia 7 7 132 1 149 8 3/18 18.62 6.77 16.50 0 0 Women's World T20 7 7 150 0 152 12 4/22 12.66 6.08 12.50 1 0 England Women tour of New Zealand 6 6 84 0 116 7 3/30 16.57 8.28 12.00 0 0 Commonwealth Games Women's Cricket Competition 5 5 81 0 89 6 3/37 14.83 6.59 13.50 0 0 New Zealand Women tour of West Indies 5 5 66 0 62 5 3/29 12.40 5.63 13.20 0 0 Australia Women tour of New Zealand 4 4 66 0 101 2 1/30 50.50 9.18 33.00 0 0 England Tri-Nation T20 Women's Series 4 4 66 0 97 3 2/42 32.33 8.81 22.00 0 0 India Women tour of New Zealand 4 4 73 0 82 5 2/21 16.40 6.73 14.60 0 0 All 158 134 2,258 6 2,541 130 4/12 19.54 6.75 17.36 2 0
Sophie Devine: T20I batting by batting first or chasing Mat Inns NO Runs HS Avg BF SR 100 50 0 4s 6s Batting first 88 88 6 2,377 105 28.98 1,935 122.84 1 13 5 213 78 Chasing 66 66 15 1,440 75* 28.23 1,163 123.81 0 11 7 140 56 All 158 154 21 3,817 105 28.69 3,098 123.20 1 24 12 353 134
Sophie Devine: T20I bowling by bowling first or defending Mat Inns Balls Mdns Runs Wkts BBI Avg Econ SR 4w 5w Bowling first 60 60 1,026 2 1,205 58 4/22 20.77 7.04 17.68 1 0 Defending a total 74 74 1,232 4 1,336 72 4/12 18.55 6.50 17.11 1 0 All 158 134 2,258 6 2,541 130 4/12 19.54 6.75 17.36 2 0
- not recorded in the scorecards · N/A no dismissals or balls to divide by
Best T20I performances Sophie Devine: highest T20I scores Score BF SR 4s 6s Opponent Ground Date 105 65 161.53 12 3 South Africa Basin Reserve 2020-02-10 87 57 152.63 5 6 England St Lawrence Ground 2026-05-23 77 57 135.08 7 4 South Africa Basin Reserve 2020-02-09 75* 55 136.36 6 2 Sri Lanka WACA 2020-02-22 73 48 152.08 4 4 South Africa The County Ground 2018-06-20 72 52 138.46 8 2 India Seddon Park 2019-02-10 70 22 318.18 5 8 India M Chinnaswamy Stadium 2015-07-11 70 44 159.09 4 5 Pakistan Sharjah Cricket Stadium 2017-11-09 68* 40 170.00 8 2 South Africa County Ground, Bristol 2018-06-28 64 34 188.23 6 4 South Africa Hnry Stadium 2026-03-22
Sophie Devine: best T20I bowling Figures Balls Mdns Econ Opponent Ground Date 4/12 24 0 3.00 South Africa Bay Oval 2026-03-15 4/22 24 0 5.50 West Indies Wankhede Stadium 2016-03-31 3/9 22 1 2.45 West Indies Bay Oval 2014-03-09 3/12 18 1 4.00 West Indies Bay Oval 2018-03-16 3/16 18 0 5.33 South Africa M Chinnaswamy Stadium 2016-03-26 3/18 24 0 4.50 Australia Allan Border Field 2020-09-26 3/24 24 0 6.00 Australia Bellerive Oval 2010-02-22 3/26 24 0 6.50 England County Ground, Hove 2010-07-02 3/29 24 0 7.25 West Indies Sir Vivian Richards Stadium 2022-10-05 3/30 24 0 7.50 England Sky Stadium 2021-03-07
Latest T20I matches Latest T20I matches Date Opponent Bat Bowl Ground Result 2026-06-27 England 30 0/21 Kennington Oval England won by 9 wickets 2026-06-23 Scotland 1 2/19 County Ground, Bristol New Zealand won by 6 wickets 2026-06-16 Sri Lanka 45 0/18 The Rose Bowl Sri Lanka won by 5 wickets 2026-06-13 West Indies 22 0/27 The Rose Bowl West Indies won by 7 wickets 2026-05-25 England 0 - The County Ground England won by 7 wickets 2026-05-23 England 87 0/19 St Lawrence Ground New Zealand won by 14 runs 2026-05-20 England 45 0/21 The County Ground England won by 7 wickets 2026-03-25 South Africa 0 2/8 Hagley Oval New Zealand won by 92 runs 2026-03-22 South Africa 64 1/27 Hnry Stadium New Zealand won by 6 wickets 2026-03-20 South Africa 55* 2/21 Eden Park New Zealand won by 6 wickets
Questions about Sophie Devine How many ODI runs has Sophie Devine scored? Sophie Devine has 4,279 runs in 144 women's ODI innings from 159 matches at an average of 32.66 and a strike rate of 85.01. Highest score: 145. Full answer →
What is Sophie Devine's ODI batting average? Sophie Devine's ODI batting average in women's internationals is 32.66, from 4,279 runs and 144 innings. Full answer →
How many ODI wickets has Sophie Devine taken? Sophie Devine has taken 111 wickets in women's ODI from 159 matches at a bowling average of 36.27. Best innings: 3/24. Full answer →
How many T20I runs has Sophie Devine scored? Sophie Devine has 3,817 runs in 154 women's T20I innings from 158 matches at an average of 28.69 and a strike rate of 123.20. Highest score: 105. Full answer →
What is Sophie Devine's T20I batting average? Sophie Devine's T20I batting average in women's internationals is 28.69, from 3,817 runs and 154 innings. Full answer →
How many T20I wickets has Sophie Devine taken? Sophie Devine has taken 130 wickets in women's T20I from 158 matches at a bowling average of 19.54. Best innings: 4/12. Full answer →