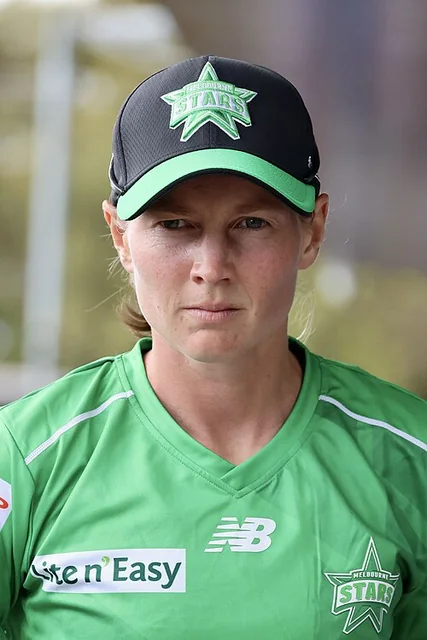
Home / Players / Meg Lanning ⓘ Meg Lanning Australia Women Top-order batter 2010 to 2023
241 Internationals 33rd among women
8,352 Runs 10th among women
17 Hundreds 3rd among women
5 Wickets
101 Catches 20th among women
Overview Test6 ODI103 T20I132 Recent scores Oldest on the left. Recorded scorecards only. The top edge marks the result for their side.
Last 12 batting innings 380 Runs
38.00 Average
103.82 Strike rate
Last 12 bowling innings 5 Wickets
2/17 Best
4.50 Economy
Career records by format Batting career records by format Format Mat Inns NO Runs HS Avg BF SR 100s 50s 0s 4s 6s Test 6 12 1 345 93 31.36 774 44.57 0 2 1 51 0 ODI 103 102 16 4,602 152* 53.51 4,991 92.20 15 21 9 572 40 T20I 132 121 28 3,405 133* 36.61 2,926 116.37 2 15 1 405 47
Bowling career records by format Format Mat Inns Balls Mdns Runs Wkts BBI BBM Avg Econ SR 4w 5w 10w Test 6 3 48 3 10 0 - - N/A 1.25 N/A 0 0 0 ODI 103 7 132 0 114 1 1/30 1/30 114.00 5.18 132.00 0 0 - T20I 132 3 36 0 39 4 2/17 2/17 9.75 6.50 9.00 0 0 -
Fielding career records by format Format Mat Inns Ct St Dis Dis/inns Best Test 6 11 3 0 3 0.272 1 (1ct 0st) ODI 103 103 53 0 53 0.514 2 (2ct 0st) T20I 132 131 45 0 45 0.343 2 (2ct 0st)
Runs by format
345 4% 4,602 55% 3,405 41%
Career records checked 2026-11-09. Independent of the scorecard archive.
Australia · Compare with another player
A CLOSER LOOK Records against the opposition Selected studies with at least ten batting or bowling innings. Each page includes sample sizes, yearly trends and the scorecards behind the figures.
Innings explorer 241 scorecards Open explorer
Scorecard coverage Scorecard coverage of the official career Format Official bat inns In scorecards Official bowl inns In scorecards First Latest Coverage Test 12 12 3 3 2013-08-11 2022-01-27 Complete ODI 102 102 7 7 2011-01-05 2023-01-21 Complete T20I 121 121 3 3 2010-12-30 2023-02-26 Complete
345 Runs 93rd among women
31.36 Average
44.57 Strike rate
0 Hundreds
2 Fifties
93 Highest
Recent scores Oldest on the left. Recorded scorecards only. The top edge marks the result for their side.
Last 12 batting innings 345 Runs
31.36 Average
44.57 Strike rate
Official Test record Official Test batting record Batting Mat Inns NO Runs HS Avg BF SR 100 50 0 4s 6s Career 6 12 1 345 93 31.36 774 44.57 0 2 1 51 0
Official Test bowling record Bowling Mat Inns Balls Mdns Runs Wkts BBI BBM Avg Econ SR 4w 5w 10w Career 6 3 48 3 10 0 - - N/A 1.25 N/A 0 0 0
Official Test fielding record Fielding Mat Inns Ct St Dis Dis/Inns Best Career 6 11 3 0 3 0.272 1 (1ct 0st)
Test career in charts Test batting form: average over 10 innings 8 16 24 32 Overall 31.4 Best spell: 31.7 up to 2022-01-27 Best 31.7 Latest: 29.0 2021 2022 Test runs by year 0 30 60 90 2013: 84 runs 84 2013 2014: 20 runs 20 2015: 3 runs 3 2015 2016: 0 runs 2017: 0 runs 2017 2018: 0 runs 2019: 78 runs 78 2019 2020: 0 runs 2021: 55 runs 55 2021 2022: 105 runs 105 2022 Last 20 Test innings
0 1-49 50-99 100+ * not out
Test innings by score How Test innings ended Caught 7 · 58.3%
Bowled 1 · 8.3%
LBW 2 · 16.7%
Run out 1 · 8.3%
Not out 1 · 8.3%
Test batting position: average and innings Test runs from boundaries Fours 204 · 59.1%
Other runs 141 · 40.9%
Test record by situation complete career Opposition Home and away Match innings Batting position Match result Year Series and tournaments
Meg Lanning: Test batting by opposition Mat Inns NO Runs HS Avg BF SR 100 50 0 4s 6s England 5 10 0 290 93 29.00 653 44.41 0 2 1 42 0 India 1 2 1 55 38 55.00 121 45.45 0 0 0 9 0 All 6 12 1 345 93 31.36 774 44.57 0 2 1 51 0
Meg Lanning: Test batting by home and away Mat Inns NO Runs HS Avg BF SR 100 50 0 4s 6s Home 3 6 1 180 93 36.00 379 47.49 0 1 0 26 0 Away 3 6 0 165 57 27.50 395 41.77 0 1 1 25 0 All 6 12 1 345 93 31.36 774 44.57 0 2 1 51 0
Meg Lanning: Test batting by match innings Mat Inns NO Runs HS Avg BF SR 100 50 0 4s 6s 1st innings of the match 4 4 0 201 93 50.25 416 48.31 0 2 0 30 0 2nd innings of the match 2 2 0 43 38 21.50 97 44.32 0 0 0 8 0 3rd innings of the match 4 4 0 69 36 17.25 175 39.42 0 0 1 8 0 4th innings of the match 2 2 1 32 17* 32.00 86 37.20 0 0 0 5 0 All 6 12 1 345 93 31.36 774 44.57 0 2 1 51 0
Meg Lanning: Test batting by batting position Mat Inns NO Runs HS Avg BF SR 100 50 0 4s 6s No. 1 1 1 0 5 5 5.00 19 26.31 0 0 0 1 0 No. 2 2 3 0 99 48 33.00 239 41.42 0 0 0 17 0 No. 3 3 6 1 136 57 27.20 320 42.50 0 1 1 20 0 No. 5 1 2 0 105 93 52.50 196 53.57 0 1 0 13 0 All 6 12 1 345 93 31.36 774 44.57 0 2 1 51 0
Meg Lanning: Test batting by match result Mat Inns NO Runs HS Avg BF SR 100 50 0 4s 6s Won 1 2 0 3 3 1.50 7 42.85 0 0 1 0 0 Lost 1 2 0 20 15 10.00 62 32.25 0 0 0 4 0 Drawn 4 8 1 322 93 46.00 705 45.67 0 2 0 47 0 All 6 12 1 345 93 31.36 774 44.57 0 2 1 51 0
Meg Lanning: Test batting by year Mat Inns NO Runs HS Avg BF SR 100 50 0 4s 6s 2013 1 2 0 84 48 42.00 196 42.85 0 0 0 14 0 2014 1 2 0 20 15 10.00 62 32.25 0 0 0 4 0 2015 1 2 0 3 3 1.50 7 42.85 0 0 1 0 0 2019 1 2 0 78 57 39.00 192 40.62 0 1 0 11 0 2021 1 2 1 55 38 55.00 121 45.45 0 0 0 9 0 2022 1 2 0 105 93 52.50 196 53.57 0 1 0 13 0 All 6 12 1 345 93 31.36 774 44.57 0 2 1 51 0
Meg Lanning: Test batting by series and tournaments Mat Inns NO Runs HS Avg BF SR 100 50 0 4s 6s Women's Ashes 3 6 0 192 93 32.00 399 48.12 0 1 1 27 0 All 6 12 1 345 93 31.36 774 44.57 0 2 1 51 0
- not recorded in the scorecards · N/A no dismissals or balls to divide by
Best Test performances Meg Lanning: highest Test scores Score BF SR 4s 6s Opponent Ground Date 93 170 54.70 13 0 England Manuka Oval 2022-01-27 57 134 42.53 9 0 England The County Ground 2019-07-18 48 108 44.44 8 0 England Sir Paul Getty's Ground 2013-08-11 38 78 48.71 7 0 India Metricon Stadium 2021-09-30 36 88 40.90 6 0 England Sir Paul Getty's Ground 2013-08-11 21 58 36.20 2 0 England The County Ground 2019-07-18 17* 43 39.53 2 0 India Metricon Stadium 2021-09-30 15 43 34.88 3 0 England WACA Ground 2014-01-10 12 26 46.15 0 0 England Manuka Oval 2022-01-27 5 19 26.31 1 0 England WACA Ground 2014-01-10
Latest Test matches Latest Test matches Date Opponent Bat Bowl Ground Result 2022-01-27 England 93 & 12 - Manuka Oval Match drawn 2021-09-30 India 38 & 17* - Metricon Stadium Match drawn 2019-07-18 England 57 & 21 - The County Ground Match drawn 2015-08-11 England 3 & 0 0/2 & 0/1 St Lawrence Ground Australia won by 161 runs 2014-01-10 England 5 & 15 - WACA Ground England won by 61 runs 2013-08-11 England 48 & 36 0/7 Sir Paul Getty's Ground Match drawn
4,602 Runs 13th among women
53.51 Average
92.20 Strike rate
15 Hundreds 1st among women
21 Fifties
152* Highest
Recent scores Oldest on the left. Recorded scorecards only. The top edge marks the result for their side.
Last 12 batting innings 590 Runs
65.55 Average
89.39 Strike rate
1 Hundreds
Official ODI record Official ODI batting record Batting Mat Inns NO Runs HS Avg BF SR 100 50 0 4s 6s Career 103 102 16 4,602 152* 53.51 4,991 92.20 15 21 9 572 40
Official ODI bowling record Bowling Mat Inns Balls Mdns Runs Wkts BBI BBM Avg Econ SR 4w 5w 10w Career 103 7 132 0 114 1 1/30 1/30 114.00 5.18 132.00 0 0 -
Official ODI fielding record Fielding Mat Inns Ct St Dis Dis/Inns Best Career 103 103 53 0 53 0.514 2 (2ct 0st)
ODI career in charts ODI batting form: average over 10 innings 30 60 90 120 Overall 53.5 Best spell: 100.5 up to 2021-04-07 Best 100.5 Latest: 55.9 2012 2014 2016 2018 2020 2022 ODI runs by year 0 200 400 600 2011: 223 runs 223 2011 2012: 484 runs 484 2013: 346 runs 346 2013 2014: 499 runs 499 2015: 195 runs 195 2015 2016: 761 runs 761 2017: 491 runs 491 2017 2018: 217 runs 217 2019: 477 runs 477 2019 2020: 163 runs 163 2021: 128 runs 128 2021 2022: 479 runs 479 2023: 139 runs 139 2023 Last 20 ODI innings
0 1-49 50-99 100+ * not out
ODI innings by score How ODI innings ended Caught 57 · 55.9%
Bowled 16 · 15.7%
LBW 4 · 3.9%
Run out 4 · 3.9%
Stumped 3 · 2.9%
Caught and bowled 2 · 2.0%
Not out 16 · 15.7%
ODI batting position: average and innings ODI runs from boundaries Fours 2,288 · 49.7%
Sixes 240 · 5.2%
Other runs 2,074 · 45.1%
ODI record by situation complete career Opposition Home and away Batting first or chasing Batting position Match result Year Ground Series and tournaments
Meg Lanning: ODI batting by opposition Mat Inns NO Runs HS Avg BF SR 100 50 0 4s 6s New Zealand 24 24 4 1,196 127 59.80 1,205 99.25 6 3 0 136 21 England 23 23 2 881 104* 41.95 1,046 84.22 2 6 3 110 5 India 16 16 2 645 128 46.07 746 86.46 1 4 2 89 3 Pakistan 11 11 0 438 124 39.81 460 95.21 1 3 1 57 2 West Indies 11 11 3 584 135* 73.00 647 90.26 2 3 2 72 5 Sri Lanka 9 9 3 434 152* 72.33 424 102.35 1 1 0 57 3 South Africa 7 7 2 424 135* 84.80 454 93.39 2 1 0 51 1 Bangladesh 1 1 0 0 0 0.00 8 0.00 0 0 1 0 0 All 103 102 16 4,602 152* 53.51 4,990 92.22 15 21 9 572 40
Meg Lanning: ODI batting by home and away Mat Inns NO Runs HS Avg BF SR 100 50 0 4s 6s Home 43 43 8 1,988 135* 56.80 2,110 94.21 5 13 3 249 19 Away 34 34 4 1,529 128 50.96 1,682 90.90 6 5 2 184 14 Neutral 25 25 4 1,085 152* 51.66 1,198 90.56 4 3 4 139 7 All 103 102 16 4,602 152* 53.51 4,990 92.22 15 21 9 572 40
Meg Lanning: ODI batting by batting first or chasing Mat Inns NO Runs HS Avg BF SR 100 50 0 4s 6s Batting first 47 47 1 1,977 134 42.97 2,190 90.27 5 9 1 258 12 Chasing 55 55 15 2,625 152* 65.62 2,800 93.75 10 12 8 314 28 All 103 102 16 4,602 152* 53.51 4,990 92.22 15 21 9 572 40
Meg Lanning: ODI batting by batting position Mat Inns NO Runs HS Avg BF SR 100 50 0 4s 6s No. 1 15 15 0 640 112 42.66 643 99.53 2 3 1 95 9 No. 2 12 12 1 380 104* 34.54 437 86.95 1 2 2 51 2 No. 3 70 70 14 3,453 152* 61.66 3,775 91.47 12 16 6 414 28 No. 4 4 4 1 119 40 39.66 130 91.53 0 0 0 10 1 No. 5 1 1 0 10 10 10.00 5 200.00 0 0 0 2 0 All 103 102 16 4,602 152* 53.51 4,990 92.22 15 21 9 572 40
Meg Lanning: ODI batting by match result Mat Inns NO Runs HS Avg BF SR 100 50 0 4s 6s Won 88 88 16 4,342 152* 60.30 4,640 93.57 15 19 4 535 39 Lost 13 13 0 257 87 19.76 337 76.26 0 2 5 37 1 Tied 1 1 0 3 3 3.00 13 23.07 0 0 0 0 0 All 103 102 16 4,602 152* 53.51 4,990 92.22 15 21 9 572 40
Meg Lanning: ODI batting by year Mat Inns NO Runs HS Avg BF SR 100 50 0 4s 6s 2011 8 8 1 223 104* 31.85 266 83.83 1 0 1 28 1 2012 7 7 0 484 128 69.14 378 128.04 2 2 0 72 8 2013 10 10 0 346 112 34.60 413 83.77 1 2 2 51 2 2014 11 11 1 499 135* 49.90 525 95.04 1 3 1 62 3 2015 3 3 0 195 104 65.00 205 95.12 1 1 0 24 0 2016 15 15 3 761 134 63.41 817 93.14 3 2 0 91 7 2017 9 9 3 491 152* 81.83 534 91.94 2 1 1 53 5 2018 6 6 0 217 124 36.16 233 93.13 1 0 0 33 0 2019 11 11 2 477 121 53.00 558 85.48 1 3 0 58 5 2020 2 2 2 163 101* N/A 166 98.19 1 1 0 14 5 2021 6 6 1 128 53* 25.60 180 71.11 0 1 1 14 0 2022 12 12 3 479 135* 53.22 569 84.18 1 3 3 55 3 2023 2 2 0 139 72 69.50 146 95.20 0 2 0 17 1 All 103 102 16 4,602 152* 53.51 4,990 92.22 15 21 9 572 40
Meg Lanning: ODI batting by ground Mat Inns NO Runs HS Avg BF SR 100 50 0 4s 6s Bay Oval 9 9 2 498 127 71.14 540 92.22 3 0 0 46 7 Allan Border Field 6 6 3 368 101* 122.66 381 96.58 1 3 0 41 5 Basin Reserve 5 5 2 166 135* 55.33 185 89.72 1 0 2 16 1 County Ground, Bristol 5 5 2 420 152* 140.00 431 97.44 2 1 0 49 3 North Sydney Oval 5 5 1 365 103 91.25 283 128.97 1 3 0 48 7 The County Ground 5 5 0 82 64 16.40 121 67.76 0 1 2 12 0 Brisbane Cricket Ground 4 4 0 43 18 10.75 55 78.18 0 0 0 5 1 Manuka Oval 4 4 0 223 134 55.75 249 89.55 1 0 0 32 1 Barabati Stadium 3 3 0 141 112 47.00 161 87.57 1 0 0 19 1 Bellerive Oval 3 3 0 128 61 42.66 137 93.43 0 1 0 20 1 Brabourne Stadium 3 3 0 85 37 28.33 101 84.15 0 0 0 15 1 Great Barrier Reef Arena 3 3 1 59 53* 29.50 94 62.76 0 1 1 8 0 Junction Oval 3 3 1 105 57* 52.50 133 78.94 0 1 1 13 1 Kinrara Academy Oval 3 3 0 142 124 47.33 138 102.89 1 0 0 22 0 All 103 102 16 4,602 152* 53.51 4,990 92.22 15 21 9 572 40
Meg Lanning: ODI batting by series and tournaments Mat Inns NO Runs HS Avg BF SR 100 50 0 4s 6s ICC Women's Championship 23 23 4 1,261 135* 66.36 1,332 94.66 5 5 1 163 4 ICC Women's World Cup 18 18 4 807 152* 57.64 901 89.56 2 3 3 97 6 Rose Bowl 9 9 1 417 104* 52.12 420 99.28 1 2 0 48 6 Women's Ashes 9 9 1 263 64 32.87 343 76.67 0 3 2 36 2 Australia Women tour of England 3 3 0 103 69 34.33 121 85.12 0 1 0 14 1 Australia Women tour of New Zealand 3 3 0 69 49 23.00 86 80.23 0 0 0 6 0 India Women tour of Australia 3 3 1 59 53* 29.50 94 62.76 0 1 1 8 0 All 103 102 16 4,602 152* 53.51 4,990 92.22 15 21 9 572 40
- not recorded in the scorecards · N/A no dismissals or balls to divide by
Best ODI performances Meg Lanning: highest ODI scores Score BF SR 4s 6s Opponent Ground Date 152* 135 112.59 19 1 Sri Lanka County Ground, Bristol 2017-06-29 135* 127 106.29 21 0 West Indies Bradman Oval 2014-11-16 135* 130 103.84 15 1 South Africa Basin Reserve 2022-03-22 134 122 109.83 20 0 South Africa Manuka Oval 2016-11-20 128 104 123.07 19 1 India Wankhede Stadium 2012-03-14 127 135 94.07 10 2 New Zealand Bay Oval 2016-02-24 124 106 116.98 19 0 Pakistan Kinrara Academy Oval 2018-10-20 121 145 83.44 12 4 West Indies Coolidge Cricket Ground 2019-09-05 114* 113 100.88 12 3 New Zealand Bay Oval 2016-02-22 112 104 107.69 17 1 New Zealand Barabati Stadium 2013-02-05
Latest ODI matches Latest ODI matches Date Opponent Bat Bowl Ground Result 2023-01-21 Pakistan 72 - North Sydney Oval Australia won by 101 runs 2023-01-18 Pakistan v Australia did not bat - Allan Border Field Australia won by 10 wickets 2023-01-16 Pakistan 67 - Allan Border Field Australia won by 8 wickets (D/L method) 2022-04-03 England 10 - Hagley Oval Australia won by 71 runs 2022-03-30 West Indies 26* - Basin Reserve Australia won by 157 runs 2022-03-25 Bangladesh 0 - Basin Reserve Australia won by 5 wickets 2022-03-22 South Africa 135* - Basin Reserve Australia won by 5 wickets 2022-03-19 India 97 - Eden Park Australia won by 6 wickets 2022-03-15 West Indies 0 - Basin Reserve Australia won by 7 wickets 2022-03-13 New Zealand 5 - Basin Reserve Australia won by 141 runs
3,405 Runs 11th among women
36.61 Average
116.37 Strike rate
2 Hundreds 8th among women
15 Fifties
133* Highest
Recent scores Oldest on the left. Recorded scorecards only. The top edge marks the result for their side.
Last 12 batting innings 285 Runs
31.66 Average
115.85 Strike rate
Last 3 bowling innings 4 Wickets
2/17 Best
6.50 Economy
Official T20I record Official T20I batting record Batting Mat Inns NO Runs HS Avg BF SR 100 50 0 4s 6s Career 132 121 28 3,405 133* 36.61 2,926 116.37 2 15 1 405 47
Official T20I bowling record Bowling Mat Inns Balls Mdns Runs Wkts BBI BBM Avg Econ SR 4w 5w 10w Career 132 3 36 0 39 4 2/17 2/17 9.75 6.50 9.00 0 0 -
Official T20I fielding record Fielding Mat Inns Ct St Dis Dis/Inns Best Career 132 131 45 0 45 0.343 2 (2ct 0st)
T20I career in charts T20I batting form: average over 20 innings 20 40 60 80 Overall 36.6 Best spell: 72.2 up to 2019-10-02 Best 72.2 Latest: 39.0 2012 2014 2016 2018 2020 2022 T20I runs by year 0 200 400 600 2010: 10 runs 10 2010 2011: 201 runs 201 2012: 341 runs 341 2012 2013: 234 runs 234 2014: 625 runs 625 2014 2015: 106 runs 106 2016: 339 runs 339 2016 2017: 74 runs 74 2018: 385 runs 385 2018 2019: 265 runs 265 2020: 279 runs 279 2020 2021: 84 runs 84 2022: 268 runs 268 2022 2023: 194 runs 194 2023 Last 20 T20I innings
0 1-49 50-99 100+ * not out
T20I innings by score How T20I innings ended Caught 41 · 33.9%
Bowled 24 · 19.8%
LBW 12 · 9.9%
Run out 12 · 9.9%
Stumped 2 · 1.7%
Caught and bowled 1 · 0.8%
Hit wicket 1 · 0.8%
Not out 28 · 23.1%
T20I batting position: average and innings T20I runs from boundaries Fours 1,620 · 47.6%
Sixes 282 · 8.3%
Other runs 1,503 · 44.1%
T20I record by situation complete career Opposition Home and away Batting first or chasing Batting position Match result Year Ground Series and tournaments
Meg Lanning: T20I batting by opposition Mat Inns NO Runs HS Avg BF SR 100 50 0 4s 6s New Zealand 32 32 3 663 76 22.86 622 106.59 0 4 1 79 7 England 29 29 7 987 133* 44.86 766 128.85 1 5 0 124 16 India 21 21 4 557 49* 32.76 520 107.11 0 0 0 56 10 Pakistan 12 12 3 276 50 30.66 245 112.65 0 1 0 30 4 West Indies 10 10 3 332 54* 47.42 301 110.29 0 3 0 43 1 Ireland 6 6 1 302 126 60.40 203 148.76 1 1 0 40 6 South Africa 5 5 2 96 49* 32.00 89 107.86 0 0 0 11 1 Sri Lanka 4 4 3 108 56* 108.00 110 98.18 0 1 0 13 0 Bangladesh 1 1 1 48 48* N/A 49 97.95 0 0 0 4 0 Barbados 1 1 1 36 36* N/A 21 171.42 0 0 0 5 2 All 132 121 28 3,405 133* 36.61 2,926 116.37 2 15 1 405 47
Meg Lanning: T20I batting by home and away Mat Inns NO Runs HS Avg BF SR 100 50 0 4s 6s Home 49 49 11 1,298 78* 34.15 1,102 117.78 0 7 0 152 14 Away 36 36 9 1,015 133* 37.59 912 111.29 1 3 0 106 17 Neutral 35 35 8 1,083 126 40.11 890 121.68 1 5 1 146 16 Unknown 1 1 0 9 9 9.00 22 40.90 0 0 0 1 0 All 132 121 28 3,405 133* 36.61 2,926 116.37 2 15 1 405 47
Meg Lanning: T20I batting by batting first or chasing Mat Inns NO Runs HS Avg BF SR 100 50 0 4s 6s Batting first 66 66 10 2,054 133* 36.67 1,664 123.43 2 9 1 248 35 Chasing 55 55 18 1,351 64* 36.51 1,262 107.05 0 6 0 157 12 All 132 121 28 3,405 133* 36.61 2,926 116.37 2 15 1 405 47
Meg Lanning: T20I batting by batting position Mat Inns NO Runs HS Avg BF SR 100 50 0 4s 6s No. 1 20 20 1 618 76 32.52 569 108.61 0 5 0 75 2 No. 2 19 19 1 316 40 17.55 318 99.37 0 0 0 32 4 No. 3 62 62 17 1,984 133* 44.08 1,644 120.68 2 8 0 231 37 No. 4 14 14 5 326 88* 36.22 270 120.74 0 1 1 45 3 No. 5 5 5 3 131 56* 65.50 106 123.58 0 1 0 17 1 No. 6 1 1 1 30 30* N/A 19 157.89 0 0 0 5 0 All 132 121 28 3,405 133* 36.61 2,926 116.37 2 15 1 405 47
Meg Lanning: T20I batting by match result Mat Inns NO Runs HS Avg BF SR 100 50 0 4s 6s Won 87 87 26 2,668 133* 43.73 2,239 119.16 2 11 0 320 39 Lost 32 32 1 736 78* 23.74 680 108.23 0 4 1 85 8 Tied 1 1 0 1 1 1.00 5 20.00 0 0 0 0 0 No result 1 1 1 0 0* N/A 2 0.00 0 0 0 0 0 All 132 121 28 3,405 133* 36.61 2,926 116.37 2 15 1 405 47
Meg Lanning: T20I batting by year Mat Inns NO Runs HS Avg BF SR 100 50 0 4s 6s 2010 1 1 0 10 10 10.00 8 125.00 0 0 0 0 1 2011 12 12 0 201 34 16.75 180 111.66 0 0 0 23 2 2012 14 14 1 341 42 26.23 355 96.05 0 0 0 37 2 2013 5 5 0 234 76 46.80 200 117.00 0 3 0 26 1 2014 17 17 5 625 126 52.08 430 145.34 1 3 0 79 12 2015 5 5 0 106 43 21.20 101 104.95 0 0 0 13 1 2016 12 12 2 339 56* 33.90 310 109.35 0 3 1 41 4 2017 3 3 0 74 60 24.66 82 90.24 0 1 0 10 0 2018 13 13 6 385 88* 55.00 320 120.31 0 2 0 52 3 2019 7 7 5 265 133* 132.50 201 131.84 1 1 0 31 7 2020 12 12 3 279 49* 31.00 278 100.35 0 0 0 29 4 2021 5 5 1 84 28 21.00 89 94.38 0 0 0 8 2 2022 8 8 3 268 74 53.60 201 133.33 0 2 0 34 6 2023 7 7 2 194 49* 38.80 171 113.45 0 0 0 22 2 All 132 121 28 3,405 133* 36.61 2,926 116.37 2 15 1 405 47
Meg Lanning: T20I batting by ground Mat Inns NO Runs HS Avg BF SR 100 50 0 4s 6s Melbourne Cricket Ground 9 9 0 370 76 41.11 300 123.33 0 4 0 42 3 North Sydney Oval 8 8 2 159 56* 26.50 132 120.45 0 1 0 22 1 Adelaide Oval 5 5 2 136 64* 45.33 102 133.33 0 1 0 19 1 Edgbaston 5 5 1 91 36* 22.75 75 121.33 0 0 0 12 4 The County Ground 5 5 2 227 133* 75.66 155 146.45 1 0 0 28 8 Allan Border Field 4 4 1 90 26* 30.00 99 90.90 0 0 0 9 1 Brabourne Stadium 4 4 4 175 88* N/A 108 162.03 0 1 0 29 2 Dr. Y.S. Rajasekhara Reddy ACA-VDCA Cricket Stadium 4 4 1 146 42 48.66 158 92.40 0 0 0 11 1 Junction Oval 4 4 0 96 37 24.00 74 129.72 0 0 0 12 2 Kerrydale Oval 4 4 3 100 46* 100.00 76 131.57 0 0 0 11 1 Manuka Oval 4 4 0 59 34 14.75 46 128.26 0 0 0 8 1 Sydney Cricket Ground 4 4 1 81 49* 27.00 81 100.00 0 0 0 6 3 Sylhet International Cricket Stadium 4 4 0 184 126 46.00 110 167.27 1 1 0 24 6 Feroz Shah Kotla, Delhi 3 3 1 119 56* 59.50 111 107.20 0 2 0 15 0 Galle International Stadium 3 3 0 94 39 31.33 104 90.38 0 0 0 14 0 All 132 121 28 3,405 133* 36.61 2,926 116.37 2 15 1 405 47
Meg Lanning: T20I batting by series and tournaments Mat Inns NO Runs HS Avg BF SR 100 50 0 4s 6s ICC Women's T20 World Cup 15 15 5 396 49* 39.60 389 101.79 0 0 0 40 4 Women's World T20 10 10 2 326 56* 40.75 271 120.29 0 4 1 42 4 Women's Ashes 9 9 1 274 64* 34.25 233 117.59 0 2 0 32 3 Commonwealth Games Women's Cricket Competition 5 5 1 91 36* 22.75 75 121.33 0 0 0 12 4 ICC Women's World Twenty20 5 5 0 138 39 27.60 149 92.61 0 0 0 20 0 New Zealand Women tour of Australia 5 5 2 146 56* 48.66 143 102.09 0 1 0 18 1 Australia Tri-Nation Women's T20 Series 4 4 0 76 37 19.00 62 122.58 0 0 0 8 2 India Tri-Nation Women's T20 Series 4 4 4 175 88* N/A 108 162.03 0 1 0 29 2 Pakistan Women in Australia T20I Series 4 4 3 100 46* 100.00 76 131.57 0 0 0 11 1 Australia Women tour of England 3 3 2 178 133* 178.00 108 164.81 1 0 0 22 7 Australia Women tour of New Zealand 3 3 1 55 28 27.50 55 100.00 0 0 0 4 2 New Zealand Women in Australia T20I Series 3 3 0 74 60 24.66 82 90.24 0 1 0 10 0 All 132 121 28 3,405 133* 36.61 2,926 116.37 2 15 1 405 47
- not recorded in the scorecards · N/A no dismissals or balls to divide by
Best T20I performances Meg Lanning: highest T20I scores Score BF SR 4s 6s Opponent Ground Date 133* 63 211.11 17 7 England The County Ground 2019-07-26 126 65 193.84 18 4 Ireland Sylhet International Cricket Stadium 2014-03-27 88* 45 195.55 16 1 England Brabourne Stadium 2018-03-31 78* 54 144.44 9 1 England Bellerive Oval 2014-01-29 76 56 135.71 9 0 New Zealand Melbourne Cricket Ground 2013-01-22 74 49 151.02 9 2 Ireland Bready Cricket Club 2022-07-21 64* 44 145.45 8 0 England Adelaide Oval 2022-01-20 64 56 114.28 7 0 New Zealand Melbourne Cricket Ground 2013-01-22 60 53 113.20 6 1 England The Rose Bowl 2013-08-29 60 52 115.38 8 0 New Zealand Melbourne Cricket Ground 2017-02-17
Latest T20I matches Latest T20I matches Date Opponent Bat Bowl Ground Result 2023-02-26 South Africa 10 - Newlands Australia won by 19 runs 2023-02-23 India 49* - Newlands Australia won by 5 runs 2023-02-18 South Africa 1 - St George's Park Australia won by 6 wickets 2023-02-16 Sri Lanka v Australia did not bat - St George's Park Australia won by 10 wickets 2023-02-14 Bangladesh 48* - St George's Park Australia won by 8 wickets 2023-02-11 New Zealand 41 - Boland Park Australia won by 97 runs 2023-01-26 Pakistan 31 - Bellerive Oval Australia won by 8 wickets 2023-01-24 Pakistan 14 - North Sydney Oval Australia won by 8 wickets 2022-08-07 India 36 - Edgbaston Australia won by 9 runs 2022-08-06 New Zealand 7 - Edgbaston Australia won by 5 wickets
Questions about Meg Lanning How many Test runs has Meg Lanning scored? Meg Lanning has 345 runs in 12 women's Test innings from 6 matches at an average of 31.36 and a strike rate of 44.57. Highest score: 93. Full answer →
What is Meg Lanning's Test batting average? Meg Lanning's Test batting average in women's internationals is 31.36, from 345 runs and 12 innings. Full answer →
How many ODI runs has Meg Lanning scored? Meg Lanning has 4,602 runs in 102 women's ODI innings from 103 matches at an average of 53.51 and a strike rate of 92.20. Highest score: 152*. Full answer →
What is Meg Lanning's ODI batting average? Meg Lanning's ODI batting average in women's internationals is 53.51, from 4,602 runs and 102 innings. Full answer →
How many T20I runs has Meg Lanning scored? Meg Lanning has 3,405 runs in 121 women's T20I innings from 132 matches at an average of 36.61 and a strike rate of 116.37. Highest score: 133*. Full answer →
What is Meg Lanning's T20I batting average? Meg Lanning's T20I batting average in women's internationals is 36.61, from 3,405 runs and 121 innings. Full answer →