Home / Players / Marizanne Kapp ⓘ Marizanne Kapp South Africa Women Middle-order batter 2009 to 2026
292 Internationals 17th among women
5,680 Runs 27th among women
5 Hundreds 29th among women
283 Wickets 9th among women
58 Catches 77th among women
Overview Test4 ODI162 T20I126 Recent scores Oldest on the left. Recorded scorecards only. The top edge marks the result for their side.
Last 12 batting innings 319 Runs
31.90 Average
123.16 Strike rate
Last 12 bowling innings 14 Wickets
5/20 Best
4.90 Economy
Career records by format Batting career records by format Format Mat Inns NO Runs HS Avg BF SR 100s 50s 0s 4s 6s Test 4 8 1 395 150 56.42 654 60.39 1 2 1 63 0 ODI 162 139 39 3,511 121* 35.11 4,501 78.00 4 17 10 338 29 T20I 126 104 19 1,774 81* 20.87 1,657 107.06 0 6 6 160 24
Bowling career records by format Format Mat Inns Balls Mdns Runs Wkts BBI BBM Avg Econ SR 4w 5w 10w Test 4 4 288 22 89 1 1/20 1/22 89.00 1.85 288.00 0 0 0 ODI 162 152 6,851 123 4,388 181 5/20 5/20 24.24 3.84 37.85 4 2 - T20I 126 112 2,250 15 2,072 101 4/6 4/6 20.51 5.52 22.27 1 0 -
Fielding career records by format Format Mat Inns Ct St Dis Dis/inns Best Test 4 6 2 0 2 0.333 1 (1ct 0st) ODI 162 160 36 0 36 0.225 2 (2ct 0st) T20I 126 124 20 0 20 0.161 3 (3ct 0st)
Runs by format
395 7% 3,511 62% 1,774 31%
Wickets by format
1 0% 181 64% 101 36%
Career records checked 2026-11-09. Independent of the scorecard archive.
South Africa · Compare with another player
Innings explorer 292 scorecards Open explorer
Scorecard coverage Scorecard coverage of the official career Format Official bat inns In scorecards Official bowl inns In scorecards First Latest Coverage Test 8 8 4 4 2014-11-16 2024-12-15 Complete ODI 139 139 152 152 2009-03-10 2025-11-02 Complete T20I 104 104 112 112 2009-06-16 2026-07-02 Complete
395 Runs 74th among women
56.42 Average
60.39 Strike rate
1 Hundreds 28th among women
2 Fifties
150 Highest
Recent scores Oldest on the left. Recorded scorecards only. The top edge marks the result for their side.
Last 8 batting innings 395 Runs
56.42 Average
60.39 Strike rate
1 Hundreds
Official Test record Official Test batting record Batting Mat Inns NO Runs HS Avg BF SR 100 50 0 4s 6s Career 4 8 1 395 150 56.42 654 60.39 1 2 1 63 0
Official Test bowling record Bowling Mat Inns Balls Mdns Runs Wkts BBI BBM Avg Econ SR 4w 5w 10w Career 4 4 288 22 89 1 1/20 1/22 89.00 1.85 288.00 0 0 0
Official Test fielding record Fielding Mat Inns Ct St Dis Dis/Inns Best Career 4 6 2 0 2 0.333 1 (1ct 0st)
Test career in charts Test runs by year 0 50 100 150 2014: 19 runs 19 2014 2015: 0 runs 2016: 0 runs 2016 2017: 0 runs 2018: 0 runs 2018 2019: 0 runs 2020: 0 runs 2020 2021: 0 runs 2022: 193 runs 193 2022 2023: 0 runs 2024: 183 runs 183 2024 Last 20 Test innings
0 1-49 50-99 100+ * not out
Test innings by score How Test innings ended Caught 2 · 25.0%
Bowled 2 · 25.0%
LBW 3 · 37.5%
Not out 1 · 12.5%
Test batting position: average and innings Test runs from boundaries Fours 252 · 63.8%
Other runs 143 · 36.2%
Test record by situation complete career Opposition Home and away Match innings Batting position Match result Year
Marizanne Kapp: Test batting by opposition Mat Inns NO Runs HS Avg BF SR 100 50 0 4s 6s England 2 4 1 271 150 90.33 373 72.65 1 1 0 49 0 India 2 4 0 124 74 31.00 281 44.12 0 1 1 14 0 All 4 8 1 395 150 56.42 654 60.39 1 2 1 63 0
Marizanne Kapp: Test batting by home and away Mat Inns NO Runs HS Avg BF SR 100 50 0 4s 6s Home 1 2 0 78 57 39.00 102 76.47 0 1 0 15 0 Away 3 6 1 317 150 63.40 552 57.42 1 1 1 48 0 All 4 8 1 395 150 56.42 654 60.39 1 2 1 63 0
Marizanne Kapp: Test batting by match innings Mat Inns NO Runs HS Avg BF SR 100 50 0 4s 6s 1st innings of the match 1 1 0 150 150 150.00 213 70.42 1 0 0 26 0 2nd innings of the match 3 3 0 131 74 43.66 217 60.36 0 2 1 19 0 3rd innings of the match 3 3 1 93 43* 46.50 196 47.44 0 0 0 14 0 4th innings of the match 1 1 0 21 21 21.00 28 75.00 0 0 0 4 0 All 4 8 1 395 150 56.42 654 60.39 1 2 1 63 0
Marizanne Kapp: Test batting by batting position Mat Inns NO Runs HS Avg BF SR 100 50 0 4s 6s No. 3 1 2 0 19 19 9.50 58 32.75 0 0 1 3 0 No. 4 1 2 0 105 74 52.50 223 47.08 0 1 0 11 0 No. 5 1 2 0 78 57 39.00 102 76.47 0 1 0 15 0 No. 6 1 1 0 150 150 150.00 213 70.42 1 0 0 26 0 No. 7 1 1 1 43 43* N/A 58 74.13 0 0 0 8 0 All 4 8 1 395 150 56.42 654 60.39 1 2 1 63 0
Marizanne Kapp: Test batting by match result Mat Inns NO Runs HS Avg BF SR 100 50 0 4s 6s Lost 3 6 0 202 74 33.66 383 52.74 0 2 1 29 0 Drawn 1 2 1 193 150 193.00 271 71.21 1 0 0 34 0 All 4 8 1 395 150 56.42 654 60.39 1 2 1 63 0
Marizanne Kapp: Test batting by year Mat Inns NO Runs HS Avg BF SR 100 50 0 4s 6s 2014 1 2 0 19 19 9.50 58 32.75 0 0 1 3 0 2022 1 2 1 193 150 193.00 271 71.21 1 0 0 34 0 2024 2 4 0 183 74 45.75 325 56.30 0 2 0 26 0 All 4 8 1 395 150 56.42 654 60.39 1 2 1 63 0
- not recorded in the scorecards · N/A no dismissals or balls to divide by
Best Test performances Marizanne Kapp: highest Test scores Score BF SR 4s 6s Opponent Ground Date 150 213 70.42 26 0 England The County Ground 2022-06-27 74 141 52.48 8 0 India MA Chidambaram Stadium 2024-06-28 57 74 77.02 11 0 England Mangaung Oval 2024-12-15 43* 58 74.13 8 0 England The County Ground 2022-06-27 31 82 37.80 3 0 India MA Chidambaram Stadium 2024-06-28 21 28 75.00 4 0 England Mangaung Oval 2024-12-15 19 56 33.92 3 0 India Mysore 2014-11-16 0 2 0.00 0 0 India Mysore 2014-11-16
Latest Test matches Latest Test matches Date Opponent Bat Bowl Ground Result 2024-12-15 England 57 & 21 1/20 & 0/2 Mangaung Oval England won by 286 runs 2024-06-28 India 74 & 31 - MA Chidambaram Stadium India won by 10 wickets 2022-06-27 England 150 & 43* 0/40 The County Ground Match drawn 2014-11-16 India 0 & 19 0/27 Mysore India won by inns & 34 runs
3,511 Runs 25th among women
35.11 Bat avg
78.00 Strike rate
181 Wickets 3rd among women
24.24 Bowl avg
3.84 Economy
Recent scores Oldest on the left. Recorded scorecards only. The top edge marks the result for their side.
Last 12 batting innings 433 Runs
48.11 Average
95.16 Strike rate
1 Hundreds
Last 12 bowling innings 15 Wickets
5/20 Best
4.03 Economy
Official ODI record Official ODI batting record Batting Mat Inns NO Runs HS Avg BF SR 100 50 0 4s 6s Career 162 139 39 3,511 121* 35.11 4,501 78.00 4 17 10 338 29
Official ODI bowling record Bowling Mat Inns Balls Mdns Runs Wkts BBI BBM Avg Econ SR 4w 5w 10w Career 162 152 6,851 123 4,388 181 5/20 5/20 24.24 3.84 37.85 4 2 -
Official ODI fielding record Fielding Mat Inns Ct St Dis Dis/Inns Best Career 162 160 36 0 36 0.225 2 (2ct 0st)
ODI career in charts ODI batting form: average over 20 innings 20 40 60 80 Overall 34.8 Best spell: 64.8 up to 2024-04-13 Best 64.8 Latest: 44.9 2013 2016 2019 2022 2025 ODI runs by year 0 200 400 2009: 7 runs 2009 2010: 48 runs 2011: 95 runs 2012: 50 runs 2012 2013: 489 runs 2014: 228 runs 2015: 26 runs 2015 2016: 326 runs 2017: 263 runs 2018: 94 runs 2018 2019: 192 runs 2020: 16 runs 2021: 183 runs 2021 2022: 350 runs 2023: 300 runs 2024: 449 runs 2024 2025: 395 runs 2025 Last 20 ODI innings
0 1-49 50-99 100+ * not out
ODI innings by score How ODI innings ended Caught 56 · 40.3%
Bowled 14 · 10.1%
LBW 13 · 9.4%
Run out 10 · 7.2%
Stumped 4 · 2.9%
Caught and bowled 3 · 2.2%
Other dismissal 1 · 0.7%
Not out 38 · 27.3%
ODI batting position: average and innings ODI runs from boundaries Fours 1,348 · 38.4%
Sixes 174 · 5.0%
Other runs 1,989 · 56.7%
ODI bowling form: wickets per innings over 20 innings 1 Overall 1.19 Best spell: 1.70 up to 2019-02-14 Best 1.70 Latest: 1.25 2013 2016 2019 2022 2025 ODI wickets by year 0 7 14 21 28 2009: 0 wickets 2009 2010: 0 wickets 2011: 5 wickets 2012: 4 wickets 2012 2013: 19 wickets 2014: 17 wickets 2015: 0 wickets 2015 2016: 15 wickets 2017: 28 wickets 2018: 18 wickets 2018 2019: 12 wickets 2020: 5 wickets 2021: 11 wickets 2021 2022: 13 wickets 2023: 6 wickets 2024: 11 wickets 2024 2025: 17 wickets 2025 Last 20 ODI bowling innings
ODI innings by wickets
ODI record by situation complete career Opposition Home and away Batting first or chasing Batting position Match result Year Ground Series and tournaments Bowling first or defending
Marizanne Kapp: ODI batting by opposition Mat Inns NO Runs HS Avg BF SR 100 50 0 4s 6s India 24 24 5 549 114 28.89 685 80.14 1 1 1 44 7 England 21 21 1 433 73 21.65 479 90.39 0 2 4 50 6 Pakistan 20 20 8 745 121* 62.08 993 75.02 3 2 0 72 7 West Indies 16 16 4 325 69* 27.08 498 65.26 0 1 0 21 3 Bangladesh 15 15 5 312 59* 31.20 441 70.74 0 2 1 27 1 Australia 13 13 5 347 75 43.37 463 74.94 0 4 2 43 0 New Zealand 13 13 3 284 72 28.40 382 74.34 0 1 3 32 0 Sri Lanka 13 13 4 480 89* 53.33 526 91.25 0 4 0 45 5 Ireland 3 3 2 20 14* 20.00 18 111.11 0 0 0 2 0 Netherlands 1 1 1 16 16* N/A 16 100.00 0 0 0 1 0 All 162 139 38 3,511 121* 34.76 4,501 78.00 4 17 11 337 29
Marizanne Kapp: ODI bowling by opposition Mat Inns Balls Mdns Runs Wkts BBI Avg Econ SR 4w 5w England 22 22 1,020 9 900 34 5/20 26.47 5.29 30.00 0 2 India 22 22 1,151 21 736 24 4/21 30.66 3.83 47.95 1 0 Pakistan 21 21 906 18 581 22 3/18 26.40 3.84 41.18 0 0 Sri Lanka 19 19 796 8 494 19 3/38 26.00 3.72 41.89 0 0 Bangladesh 18 18 843 26 356 23 2/5 15.47 2.53 36.65 0 0 West Indies 18 18 774 19 472 28 4/14 16.85 3.65 27.64 2 0 New Zealand 14 14 619 11 403 18 4/29 22.38 3.90 34.38 1 0 Australia 12 12 520 8 345 10 3/12 34.50 3.98 52.00 0 0 Ireland 5 5 169 2 89 3 2/16 29.66 3.15 56.33 0 0 Netherlands 1 1 54 1 12 0 0/12 N/A 1.33 N/A 0 0 All 162 152 6,852 123 4,388 181 5/20 24.24 3.84 37.85 4 2
Marizanne Kapp: ODI batting by home and away Mat Inns NO Runs HS Avg BF SR 100 50 0 4s 6s Home 47 47 15 1,173 77* 36.65 1,393 84.20 0 7 6 115 9 Away 56 56 15 1,503 121* 36.65 1,901 79.06 3 7 3 145 14 Neutral 36 36 8 835 102* 29.82 1,207 69.17 1 3 2 77 6 All 162 139 38 3,511 121* 34.76 4,501 78.00 4 17 11 337 29
Marizanne Kapp: ODI bowling by home and away Mat Inns Balls Mdns Runs Wkts BBI Avg Econ SR 4w 5w Home 54 54 2,390 40 1,544 56 3/24 27.57 3.87 42.67 0 0 Away 63 63 2,911 51 1,921 76 4/21 25.27 3.95 38.30 3 0 Neutral 35 35 1,551 32 923 49 5/20 18.83 3.57 31.65 1 2 All 162 152 6,852 123 4,388 181 5/20 24.24 3.84 37.85 4 2
Marizanne Kapp: ODI batting by batting first or chasing Mat Inns NO Runs HS Avg BF SR 100 50 0 4s 6s Batting first 74 74 19 1,863 102* 33.87 2,400 77.62 2 10 6 184 13 Chasing 65 65 19 1,648 121* 35.82 2,101 78.43 2 7 5 153 16 All 162 139 38 3,511 121* 34.76 4,501 78.00 4 17 11 337 29
Marizanne Kapp: ODI bowling by bowling first or defending Mat Inns Balls Mdns Runs Wkts BBI Avg Econ SR 4w 5w Bowling first 82 82 4,025 77 2,566 107 5/45 23.98 3.82 37.61 4 1 Defending a total 70 70 2,827 46 1,822 74 5/20 24.62 3.86 38.20 0 1 All 162 152 6,852 123 4,388 181 5/20 24.24 3.84 37.85 4 2
Marizanne Kapp: ODI batting by batting position Mat Inns NO Runs HS Avg BF SR 100 50 0 4s 6s No. 3 3 3 0 33 15 11.00 95 34.73 0 0 0 0 0 No. 4 30 30 7 878 121* 38.17 1,262 69.57 2 4 4 83 4 No. 5 60 60 15 1,730 114 38.44 2,083 83.05 2 10 5 172 16 No. 6 24 24 8 590 68* 36.87 747 78.98 0 2 0 65 3 No. 7 20 20 7 263 69* 20.23 285 92.28 0 1 1 16 6 No. 8 2 2 1 17 17* 17.00 29 58.62 0 0 1 1 0 All 162 139 38 3,511 121* 34.76 4,501 78.00 4 17 11 337 29
Marizanne Kapp: ODI batting by match result Mat Inns NO Runs HS Avg BF SR 100 50 0 4s 6s Won 67 67 26 2,066 121* 50.39 2,454 84.18 3 9 2 210 19 Lost 66 66 10 1,336 114 23.85 1,865 71.63 1 7 9 121 10 Tied 2 2 1 76 66 76.00 113 67.25 0 1 0 5 0 No result 4 4 1 33 17 11.00 69 47.82 0 0 0 1 0 All 162 139 38 3,511 121* 34.76 4,501 78.00 4 17 11 337 29
Marizanne Kapp: ODI bowling by match result Mat Inns Balls Mdns Runs Wkts BBI Avg Econ SR 4w 5w Won 85 85 3,803 69 2,281 114 5/20 20.00 3.59 33.35 3 2 Lost 61 61 2,780 49 1,938 60 4/55 32.30 4.18 46.33 1 0 Tied 2 2 120 4 80 3 2/57 26.66 4.00 40.00 0 0 No result 4 4 149 1 89 4 3/38 22.25 3.58 37.25 0 0 All 162 152 6,852 123 4,388 181 5/20 24.24 3.84 37.85 4 2
Marizanne Kapp: ODI batting by year Mat Inns NO Runs HS Avg BF SR 100 50 0 4s 6s 2009 2 2 0 7 7 3.50 11 63.63 0 0 1 1 0 2010 3 3 2 48 25* 48.00 96 50.00 0 0 0 5 0 2011 7 7 1 95 29 15.83 154 61.68 0 0 0 9 0 2012 2 2 0 50 39 25.00 125 40.00 0 0 0 2 0 2013 15 15 3 489 102* 40.75 723 67.63 1 3 1 50 0 2014 10 10 3 228 89* 32.57 365 62.46 0 1 0 14 0 2015 2 2 0 26 15 13.00 75 34.66 0 0 0 0 0 2016 16 16 4 326 69* 27.16 476 68.48 0 2 4 26 1 2017 18 18 4 263 38 18.78 329 79.93 0 0 0 24 0 2018 9 9 3 94 29* 15.66 128 73.43 0 0 1 5 2 2019 7 7 3 192 69* 48.00 197 97.46 0 2 0 15 4 2020 1 1 1 16 16* N/A 30 53.33 0 0 0 3 0 2021 6 6 3 183 68* 61.00 185 98.91 0 1 1 24 2 2022 11 11 3 350 73 43.75 360 97.22 0 2 0 41 3 2023 7 7 3 300 100 75.00 339 88.49 1 1 0 32 1 2024 12 12 2 449 114 44.90 507 88.56 1 3 2 50 6 2025 11 11 3 395 121* 49.37 401 98.50 1 2 1 36 10 All 162 139 38 3,511 121* 34.76 4,501 78.00 4 17 11 337 29
Marizanne Kapp: ODI bowling by year Mat Inns Balls Mdns Runs Wkts BBI Avg Econ SR 4w 5w 2009 1 1 18 0 25 0 0/25 N/A 8.33 N/A 0 0 2010 5 5 138 2 76 0 0/8 N/A 3.30 N/A 0 0 2011 6 6 318 4 235 5 2/32 47.00 4.43 63.60 0 0 2012 3 3 150 7 45 4 2/5 11.25 1.80 37.50 0 0 2013 16 16 690 13 418 19 3/18 22.00 3.63 36.31 0 0 2014 11 11 465 10 263 17 4/21 15.47 3.39 27.35 1 0 2015 1 1 42 0 29 0 0/29 N/A 4.14 N/A 0 0 2016 16 16 770 11 518 15 3/41 34.53 4.03 51.33 0 0 2017 22 22 1,018 25 583 28 4/14 20.82 3.43 36.35 1 0 2018 10 10 534 9 337 18 4/55 18.72 3.78 29.66 1 0 2019 9 9 432 10 271 12 3/20 22.58 3.76 36.00 0 0 2020 3 3 121 0 79 5 4/29 15.80 3.91 24.20 1 0 2021 10 10 534 10 321 11 3/24 29.18 3.60 48.54 0 0 2022 10 10 519 1 452 13 5/45 34.76 5.22 39.92 0 1 2023 8 8 324 5 215 6 2/21 35.83 3.98 54.00 0 0 2024 8 8 287 6 172 11 3/12 15.63 3.59 26.09 0 0 2025 13 13 492 10 349 17 5/20 20.52 4.25 28.94 0 1 All 162 152 6,852 123 4,388 181 5/20 24.24 3.84 37.85 4 2
Marizanne Kapp: ODI batting by ground Mat Inns NO Runs HS Avg BF SR 100 50 0 4s 6s Senwes Park 13 13 5 302 72 37.75 312 96.79 0 2 0 29 4 M Chinnaswamy Stadium 6 6 0 169 114 28.16 202 83.66 1 0 0 14 4 Barabati Stadium 5 5 1 198 102* 49.50 326 60.73 1 1 0 25 0 Bharat Ratna Shri Atal Bihari Vajpayee Ekana Cricket Stadium 4 4 2 68 36* 34.00 81 83.95 0 0 1 8 1 Buffalo Park 4 4 1 117 69* 39.00 154 75.97 0 1 0 7 1 Diamond Oval 4 4 2 143 77* 71.50 160 89.37 0 1 0 14 1 Doha 4 4 2 75 44* 37.50 174 43.10 0 0 0 1 0 Kingsmead 4 4 1 187 72 62.33 180 103.88 0 2 1 23 1 Willowmoore Park 4 4 2 34 18 17.00 37 91.89 0 0 1 2 0 County Ground, Bristol 3 3 0 77 73 25.66 65 118.46 0 1 0 10 1 Cox's Bazar 3 3 1 39 20* 19.50 38 102.63 0 0 0 6 0 De Beers Diamond Oval 3 3 0 55 32 18.33 109 50.45 0 0 1 3 1 Grace Road 3 3 0 82 62 27.33 91 90.10 0 1 0 9 1 JB Marks Oval 3 3 0 101 38 33.66 126 80.15 0 0 0 11 1 Kensington Oval 3 3 0 8 5 2.66 14 57.14 0 0 0 0 0 All 162 139 38 3,511 121* 34.76 4,501 78.00 4 17 11 337 29
Marizanne Kapp: ODI bowling by ground Mat Inns Balls Mdns Runs Wkts BBI Avg Econ SR 4w 5w Senwes Park 17 17 775 9 573 17 3/38 33.70 4.43 45.58 0 0 Barabati Stadium 5 5 207 5 140 7 3/18 20.00 4.05 29.57 0 0 Bharat Ratna Shri Atal Bihari Vajpayee Ekana Cricket Stadium 5 5 270 3 163 3 1/25 54.33 3.62 90.00 0 0 Diamond Oval 5 5 222 1 137 8 3/24 17.12 3.70 27.75 0 0 Buffalo Park 4 4 192 3 113 3 2/38 37.66 3.53 64.00 0 0 Doha 4 4 144 3 54 4 2/16 13.50 2.25 36.00 0 0 Grace Road 4 4 180 4 125 6 4/14 20.83 4.16 30.00 1 0 JB Marks Oval 4 4 192 4 126 6 3/24 21.00 3.93 32.00 0 0 Kingsmead 4 4 162 3 104 4 3/44 26.00 3.85 40.50 0 0 P Sara Oval 4 4 222 6 96 6 2/23 16.00 2.59 37.00 0 0 Shere Bangla National Stadium 4 4 210 9 74 4 2/5 18.50 2.11 52.50 0 0 Sinhalese Sports Club Ground 4 4 178 2 118 7 2/17 16.85 3.97 25.42 0 0 Willowmoore Park 4 4 186 3 137 6 2/21 22.83 4.41 31.00 0 0 Coolidge Cricket Ground 3 3 150 6 76 5 3/24 15.20 3.04 30.00 0 0 County Ground, Bristol 3 3 174 1 180 4 3/77 45.00 6.20 43.50 0 0 All 162 152 6,852 123 4,388 181 5/20 24.24 3.84 37.85 4 2
Marizanne Kapp: ODI batting by series and tournaments Mat Inns NO Runs HS Avg BF SR 100 50 0 4s 6s ICC Women's World Cup 21 21 4 454 68* 26.70 481 94.38 0 2 1 44 7 ICC Women's Championship 14 14 5 257 69* 28.55 336 76.48 0 1 2 16 2 South Africa Women tour of India 8 8 2 285 114 47.50 329 86.62 1 1 0 25 5 Women's Quadrangular Series (in South Africa) 5 5 2 75 23 25.00 92 81.52 0 0 0 6 0 ICC Women's World Cup Qualifier 4 4 1 86 38 28.66 106 81.13 0 0 0 7 0 Pakistan Women tour of South Africa 4 4 2 131 68* 65.50 132 99.24 0 1 0 16 1 South Africa Women tour of Pakistan 4 4 2 271 121* 135.50 302 89.73 2 0 0 30 3 Bangladesh Women tour of South Africa 3 3 2 23 9* 23.00 29 79.31 0 0 0 3 0 England Women in South Africa ODI Series 3 3 0 37 19 12.33 43 86.04 0 0 0 3 0 England Women tour of South Africa 3 3 0 60 38 20.00 79 75.94 0 0 1 7 1 New Zealand Women tour of South Africa 3 3 1 144 72 72.00 160 90.00 0 1 0 14 0 South Africa Women tour of Australia 3 3 1 125 75 62.50 149 83.89 0 2 1 20 0 All 162 139 38 3,511 121* 34.76 4,501 78.00 4 17 11 337 29
Marizanne Kapp: ODI bowling by series and tournaments Mat Inns Balls Mdns Runs Wkts BBI Avg Econ SR 4w 5w ICC Women's World Cup 23 23 1,086 16 810 37 5/20 21.89 4.47 29.35 1 2 ICC Women's Championship 15 15 805 8 591 23 4/55 25.69 4.40 35.00 1 0 ICC Women's World Cup Qualifier 6 6 294 8 124 8 2/23 15.50 2.53 36.75 0 0 South Africa Women tour of India 6 6 288 6 126 6 3/20 21.00 2.62 48.00 0 0 Bangladesh Women tour of South Africa 5 5 210 3 91 9 2/14 10.11 2.60 23.33 0 0 Pakistan Women tour of South Africa 5 5 264 8 186 8 3/44 23.25 4.22 33.00 0 0 South Africa Women tour of Pakistan 5 5 186 1 135 2 2/37 67.50 4.35 93.00 0 0 South Africa Women tour of West Indies 5 5 210 7 125 8 3/24 15.62 3.57 26.25 0 0 Women's Quadrangular Series (in South Africa) 5 5 199 3 131 2 1/22 65.50 3.94 99.50 0 0 England Women in South Africa ODI Series 3 3 168 1 161 3 1/39 53.66 5.75 56.00 0 0 England Women tour of South Africa 3 3 90 1 62 7 3/24 8.85 4.13 12.85 0 0 New Zealand Women tour of South Africa 3 3 138 3 95 2 1/37 47.50 4.13 69.00 0 0 All 162 152 6,852 123 4,388 181 5/20 24.24 3.84 37.85 4 2
Marizanne Kapp: ODI batting by batting first or chasing Mat Inns NO Runs HS Avg BF SR 100 50 0 4s 6s Batting first 74 74 19 1,863 102* 33.87 2,400 77.62 2 10 6 184 13 Chasing 65 65 19 1,648 121* 35.82 2,101 78.43 2 7 5 153 16 All 162 139 38 3,511 121* 34.76 4,501 78.00 4 17 11 337 29
Marizanne Kapp: ODI bowling by bowling first or defending Mat Inns Balls Mdns Runs Wkts BBI Avg Econ SR 4w 5w Bowling first 82 82 4,025 77 2,566 107 5/45 23.98 3.82 37.61 4 1 Defending a total 70 70 2,827 46 1,822 74 5/20 24.62 3.86 38.20 0 1 All 162 152 6,852 123 4,388 181 5/20 24.24 3.84 37.85 4 2
- not recorded in the scorecards · N/A no dismissals or balls to divide by
Best ODI performances Marizanne Kapp: highest ODI scores Score BF SR 4s 6s Opponent Ground Date 121* 128 94.53 13 2 Pakistan Gaddafi Stadium 2025-09-16 114 94 121.27 11 3 India M Chinnaswamy Stadium 2024-06-19 102* 150 68.00 11 0 Pakistan Barabati Stadium 2013-02-05 100 105 95.23 12 1 Pakistan National Bank Cricket Arena 2023-09-08 89* 90 98.88 8 0 Sri Lanka Sinhalese Sports Club Ground 2014-10-15 77* 84 91.66 6 0 Sri Lanka Diamond Oval 2024-04-13 75 87 86.20 12 0 Australia North Sydney Oval 2024-02-07 73 59 123.72 10 1 England County Ground, Bristol 2022-07-15 72 67 107.46 8 0 Sri Lanka Senwes Park 2013-10-26 72 73 98.63 7 0 New Zealand Kingsmead 2023-10-01
Marizanne Kapp: best ODI bowling Figures Balls Mdns Econ Opponent Ground Date 5/20 42 3 2.85 England Barsapara Cricket Stadium 2025-10-29 5/45 60 1 4.50 England Bay Oval 2022-03-14 4/14 42 2 2.00 West Indies Grace Road 2017-07-02 4/21 41 2 3.07 India M Chinnaswamy Stadium 2014-11-24 4/29 48 0 3.62 New Zealand Eden Park Outer Oval 2020-01-27 4/55 60 1 5.50 West Indies Kensington Oval 2018-09-22 3/12 30 1 2.40 Australia North Sydney Oval 2024-02-07 3/14 54 2 1.55 West Indies Kensington Oval 2018-09-16 3/18 42 2 2.57 Pakistan Barabati Stadium 2013-02-05 3/20 54 3 2.22 India Reliance Stadium 2019-10-14
Latest ODI matches Latest ODI matches Date Opponent Bat Bowl Ground Result 2025-11-02 India 4 0/59 Dr DY Patil Sports Academy India won by 52 runs 2025-10-29 England 42 5/20 Barsapara Cricket Stadium South Africa won by 125 runs 2025-10-25 Australia 0 1/11 Holkar Cricket Stadium Australia won by 7 wickets 2025-10-21 Pakistan 68* 3/20 R Premadasa Stadium South Africa won by 150 runs (D/L method) 2025-10-17 Sri Lanka did not bat 0/14 R Premadasa Stadium South Africa won by 10 wickets (D/L method) 2025-10-13 Bangladesh 56 0/27 Andhra Cricket Association-Visakhapatnam District Cricket Association Stadium South Africa won by 3 wickets 2025-10-09 India 20 2/45 Andhra Cricket Association-Visakhapatnam District Cricket Association Stadium South Africa won by 3 wickets 2025-10-06 New Zealand 14 1/34 Holkar Cricket Stadium South Africa won by 6 wickets 2025-10-03 England 4 0/13 Barsapara Cricket Stadium England won by 10 wickets 2025-09-19 Pakistan did not bat 2/37 Gaddafi Stadium South Africa won by 25 runs (D/L method)
1,774 Runs 54th among women
20.87 Average
107.06 Strike rate
0 Hundreds
6 Fifties
81* Highest
Recent scores Oldest on the left. Recorded scorecards only. The top edge marks the result for their side.
Last 12 batting innings 173 Runs
17.30 Average
126.27 Strike rate
Last 12 bowling innings 11 Wickets
3/23 Best
5.21 Economy
Official T20I record Official T20I batting record Batting Mat Inns NO Runs HS Avg BF SR 100 50 0 4s 6s Career 126 104 19 1,774 81* 20.87 1,657 107.06 0 6 6 160 24
Official T20I bowling record Bowling Mat Inns Balls Mdns Runs Wkts BBI BBM Avg Econ SR 4w 5w 10w Career 126 112 2,250 15 2,072 101 4/6 4/6 20.51 5.52 22.27 1 0 -
Official T20I fielding record Fielding Mat Inns Ct St Dis Dis/Inns Best Career 126 124 20 0 20 0.161 3 (3ct 0st)
T20I career in charts T20I batting form: average over 10 innings 9 18 27 36 Overall 20.9 Best spell: 35.7 up to 2024-10-09 Best 35.7 Latest: 16.9 2012 2014 2018 2020 2023 2025 T20I runs by year 0 100 200 300 2009: 29 runs 2009 2010: 1 run 2011: 0 runs 2012: 50 runs 2012 2013: 67 runs 2014: 274 runs 2015: 0 runs 2015 2016: 132 runs 2017: 0 runs 2018: 207 runs 2018 2019: 97 runs 2020: 89 runs 2021: 100 runs 2021 2022: 0 runs 2023: 177 runs 2024: 399 runs 2024 2025: 19 runs 2026: 133 runs 2026 Last 20 T20I innings
0 1-49 50-99 100+ * not out
T20I innings by score How T20I innings ended Caught 49 · 47.1%
Bowled 11 · 10.6%
LBW 4 · 3.8%
Run out 10 · 9.6%
Stumped 7 · 6.7%
Caught and bowled 3 · 2.9%
Other dismissal 1 · 1.0%
Not out 19 · 18.3%
T20I batting position: average and innings T20I runs from boundaries Fours 640 · 36.1%
Sixes 144 · 8.1%
Other runs 990 · 55.8%
T20I bowling form: wickets per innings over 10 innings 1 Overall 0.90 Best spell: 1.80 up to 2014-01-22 Best 1.80 Latest: 0.90 2012 2014 2018 2020 2025 T20I wickets by year 0 5 10 15 2009: 0 wickets 2009 2010: 1 wicket 2011: 0 wickets 2012: 4 wickets 2012 2013: 14 wickets 2014: 17 wickets 2015: 0 wickets 2015 2016: 5 wickets 2017: 0 wickets 2018: 9 wickets 2018 2019: 6 wickets 2020: 2 wickets 2021: 8 wickets 2021 2022: 0 wickets 2023: 11 wickets 2024: 11 wickets 2024 2025: 4 wickets 2026: 9 wickets 2026 Last 20 T20I bowling innings
T20I innings by wickets
T20I record by situation complete career Opposition Home and away Batting first or chasing Batting position Match result Year Ground Series and tournaments Bowling first or defending
Marizanne Kapp: T20I batting by opposition Mat Inns NO Runs HS Avg BF SR 100 50 0 4s 6s West Indies 20 20 1 293 52 15.42 342 85.67 0 1 3 22 2 Pakistan 16 16 3 289 56* 22.23 304 95.06 0 1 0 24 1 Sri Lanka 15 15 2 247 60 19.00 243 101.64 0 1 0 18 7 England 11 11 1 160 38 16.00 140 114.28 0 0 2 17 1 Australia 9 9 1 158 75 19.75 139 113.66 0 1 1 19 1 Bangladesh 9 9 5 128 25 32.00 130 98.46 0 0 0 7 0 India 9 9 2 254 81* 36.28 165 153.93 0 2 0 24 11 New Zealand 8 8 2 92 23 15.33 92 100.00 0 0 0 10 0 Ireland 6 6 2 110 31 27.50 78 141.02 0 0 0 13 1 Scotland 1 1 0 43 43 43.00 24 179.16 0 0 0 6 0 All 126 104 19 1,774 81* 20.87 1,657 107.06 0 6 6 160 24
Marizanne Kapp: T20I bowling by opposition Mat Inns Balls Mdns Runs Wkts BBI Avg Econ SR 4w 5w West Indies 18 18 361 4 328 14 3/3 23.42 5.45 25.78 0 0 Pakistan 16 16 338 2 305 18 3/16 16.94 5.41 18.77 0 0 Sri Lanka 16 16 330 0 246 19 3/17 12.94 4.47 17.36 0 0 Bangladesh 13 13 271 4 168 15 4/6 11.20 3.71 18.06 1 0 England 11 11 201 2 260 5 2/19 52.00 7.76 40.20 0 0 Australia 10 10 217 0 255 9 2/21 28.33 7.05 24.11 0 0 New Zealand 9 9 195 0 217 8 3/23 27.12 6.67 24.37 0 0 India 8 8 162 2 185 6 2/27 30.83 6.85 27.00 0 0 Ireland 8 8 133 1 79 6 2/9 13.16 3.56 22.16 0 0 Netherlands 2 2 30 0 17 1 1/6 17.00 3.40 30.00 0 0 Scotland 1 1 12 0 12 0 0/12 N/A 6.00 N/A 0 0 All 126 112 2,250 15 2,072 101 4/6 20.51 5.52 22.27 1 0
Marizanne Kapp: T20I batting by home and away Mat Inns NO Runs HS Avg BF SR 100 50 0 4s 6s Home 39 39 7 604 60 18.87 591 102.19 0 3 3 46 11 Away 32 32 4 542 75 19.35 483 112.21 0 2 2 54 7 Neutral 33 33 8 628 81* 25.12 583 107.71 0 1 1 60 6 All 126 104 19 1,774 81* 20.87 1,657 107.06 0 6 6 160 24
Marizanne Kapp: T20I bowling by home and away Mat Inns Balls Mdns Runs Wkts BBI Avg Econ SR 4w 5w Home 41 41 805 7 720 40 4/6 18.00 5.36 20.12 1 0 Away 35 35 720 6 740 26 3/3 28.46 6.16 27.69 0 0 Neutral 36 36 725 2 612 35 3/16 17.48 5.06 20.71 0 0 All 126 112 2,250 15 2,072 101 4/6 20.51 5.52 22.27 1 0
Marizanne Kapp: T20I batting by batting first or chasing Mat Inns NO Runs HS Avg BF SR 100 50 0 4s 6s Batting first 56 56 7 1,001 75 20.42 927 107.98 0 4 6 97 10 Chasing 48 48 12 773 81* 21.47 730 105.89 0 2 0 63 14 All 126 104 19 1,774 81* 20.87 1,657 107.06 0 6 6 160 24
Marizanne Kapp: T20I bowling by bowling first or defending Mat Inns Balls Mdns Runs Wkts BBI Avg Econ SR 4w 5w Bowling first 56 56 1,206 5 1,130 57 4/6 19.82 5.62 21.15 1 0 Defending a total 56 56 1,044 10 942 44 3/3 21.40 5.41 23.72 0 0 All 126 112 2,250 15 2,072 101 4/6 20.51 5.52 22.27 1 0
Marizanne Kapp: T20I batting by batting position Mat Inns NO Runs HS Avg BF SR 100 50 0 4s 6s No. 1 1 1 0 3 3 3.00 12 25.00 0 0 0 0 0 No. 2 1 1 0 1 1 1.00 7 14.28 0 0 0 0 0 No. 3 38 38 2 858 75 23.83 783 109.57 0 5 3 90 11 No. 4 31 31 7 584 81* 24.33 529 110.39 0 1 1 51 5 No. 5 15 15 1 174 33 12.42 181 96.13 0 0 0 9 4 No. 6 9 9 5 56 18* 14.00 65 86.15 0 0 1 4 0 No. 7 7 7 2 97 30 19.40 78 124.35 0 0 1 6 4 No. 8 2 2 2 1 1* N/A 2 50.00 0 0 0 0 0 All 126 104 19 1,774 81* 20.87 1,657 107.06 0 6 6 160 24
Marizanne Kapp: T20I batting by match result Mat Inns NO Runs HS Avg BF SR 100 50 0 4s 6s Won 50 50 15 1,052 81* 30.05 934 112.63 0 5 0 94 14 Lost 52 52 4 666 75 13.87 666 100.00 0 1 6 60 10 No result 2 2 0 56 36 28.00 57 98.24 0 0 0 6 0 All 126 104 19 1,774 81* 20.87 1,657 107.06 0 6 6 160 24
Marizanne Kapp: T20I bowling by match result Mat Inns Balls Mdns Runs Wkts BBI Avg Econ SR 4w 5w Won 59 59 1,196 8 991 66 4/6 15.01 4.97 18.12 1 0 Lost 51 51 1,025 7 1,048 34 3/3 30.82 6.13 30.14 0 0 No result 2 2 29 0 33 1 1/15 33.00 6.82 29.00 0 0 All 126 112 2,250 15 2,072 101 4/6 20.51 5.52 22.27 1 0
Marizanne Kapp: T20I batting by year Mat Inns NO Runs HS Avg BF SR 100 50 0 4s 6s 2009 3 3 1 29 18* 14.50 46 63.04 0 0 0 2 0 2010 2 2 1 1 1* 1.00 5 20.00 0 0 1 0 0 2012 7 7 3 50 21 12.50 64 78.12 0 0 0 3 0 2013 6 6 1 67 24* 13.40 74 90.54 0 0 0 3 0 2014 15 15 4 274 40 24.90 257 106.61 0 0 1 19 3 2016 10 10 1 132 24* 14.66 150 88.00 0 0 1 10 1 2018 14 14 4 207 38 20.70 207 100.00 0 0 0 16 5 2019 5 5 1 97 56* 24.25 100 97.00 0 1 0 8 1 2020 3 3 0 89 38 29.66 80 111.25 0 0 0 11 1 2021 6 6 0 100 36 16.66 125 80.00 0 0 1 5 0 2023 9 9 1 177 52 22.12 150 118.00 0 1 1 19 1 2024 14 14 1 399 75 30.69 283 140.98 0 3 0 50 7 2025 4 4 0 19 16 4.75 21 90.47 0 0 1 2 1 2026 6 6 1 133 81* 26.60 95 140.00 0 1 0 12 4 All 126 104 19 1,774 81* 20.87 1,657 107.06 0 6 6 160 24
Marizanne Kapp: T20I bowling by year Mat Inns Balls Mdns Runs Wkts BBI Avg Econ SR 4w 5w 2009 1 1 12 0 21 0 0/21 N/A 10.50 N/A 0 0 2010 3 3 48 0 42 1 1/6 42.00 5.25 48.00 0 0 2012 7 7 139 1 93 4 1/6 23.25 4.01 34.75 0 0 2013 8 8 176 4 104 14 4/6 7.42 3.54 12.57 1 0 2014 18 18 315 0 317 17 3/16 18.64 6.03 18.52 0 0 2016 4 4 93 0 69 5 2/17 13.80 4.45 18.60 0 0 2018 19 19 392 5 419 9 2/8 46.55 6.41 43.55 0 0 2019 5 5 102 0 83 6 3/17 13.83 4.88 17.00 0 0 2020 2 2 48 0 50 2 2/19 25.00 6.25 24.00 0 0 2021 6 6 125 1 120 8 3/24 15.00 5.76 15.62 0 0 2023 12 12 242 0 253 11 2/13 23.00 6.27 22.00 0 0 2024 14 14 294 3 260 11 2/14 23.63 5.30 26.72 0 0 2025 5 5 90 1 90 4 2/27 22.50 6.00 22.50 0 0 2026 8 8 174 0 151 9 3/23 16.77 5.20 19.33 0 0 All 126 112 2,250 15 2,072 101 4/6 20.51 5.52 22.27 1 0
Marizanne Kapp: T20I batting by ground Mat Inns NO Runs HS Avg BF SR 100 50 0 4s 6s Newlands 8 8 2 129 27* 21.50 117 110.25 0 0 0 11 3 Boland Park 4 4 0 39 16 9.75 46 84.78 0 0 0 4 1 Buffalo Park 4 4 0 84 52 21.00 74 113.51 0 1 0 8 1 Darren Sammy National Cricket Stadium 4 4 0 98 38 24.50 112 87.50 0 0 0 10 1 Kingsmead 4 4 0 60 28 15.00 72 83.33 0 0 0 1 0 MA Chidambaram Stadium 4 4 0 94 57 23.50 63 149.20 0 1 0 14 1 Senwes Park 4 4 1 52 24* 17.33 62 83.87 0 0 0 1 0 Shere Bangla National Stadium 4 4 2 35 21 17.50 33 106.06 0 0 1 3 0 Dubai International Cricket Stadium 3 3 1 64 43 32.00 45 142.22 0 0 0 8 0 Galle International Stadium 3 3 1 14 9 7.00 26 53.84 0 0 0 0 0 M Chinnaswamy Stadium 3 3 0 69 33 23.00 57 121.05 0 0 0 5 3 Sir Vivian Richards Stadium 3 3 0 60 36 20.00 79 75.94 0 0 1 4 0 Sylhet International Cricket Stadium 3 3 0 61 23 20.33 59 103.38 0 0 0 3 0 Three Ws Oval 3 3 0 3 2 1.00 13 23.07 0 0 1 0 0 West End Park International Cricket Stadium 3 3 1 70 40 35.00 74 94.59 0 0 0 4 0 All 126 104 19 1,774 81* 20.87 1,657 107.06 0 6 6 160 24
Marizanne Kapp: T20I bowling by ground Mat Inns Balls Mdns Runs Wkts BBI Avg Econ SR 4w 5w Newlands 7 7 156 2 156 6 2/17 26.00 6.00 26.00 0 0 Senwes Park 7 7 144 2 121 11 4/6 11.00 5.04 13.09 1 0 Buffalo Park 6 6 114 0 121 2 1/24 60.50 6.36 57.00 0 0 Dubai International Cricket Stadium 5 5 108 0 85 4 2/14 21.25 4.72 27.00 0 0 Darren Sammy National Cricket Stadium 4 4 78 1 49 1 1/13 49.00 3.76 78.00 0 0 Shere Bangla National Stadium 4 4 67 1 53 2 1/6 26.50 4.74 33.50 0 0 Sylhet International Cricket Stadium 4 4 77 0 67 7 3/16 9.57 5.22 11.00 0 0 The County Ground 4 4 75 0 125 1 1/32 125.00 10.00 75.00 0 0 Brian Lara Stadium 3 3 72 1 69 0 0/13 N/A 5.75 N/A 0 0 Galle International Stadium 3 3 60 0 51 1 1/11 51.00 5.10 60.00 0 0 Kingsmead 3 3 72 1 57 4 3/24 14.25 4.75 18.00 0 0 M Chinnaswamy Stadium 3 3 72 0 72 4 2/17 18.00 6.00 18.00 0 0 Sir Vivian Richards Stadium 3 3 53 0 63 4 3/31 15.75 7.13 13.25 0 0 Three Ws Oval 3 3 66 0 75 4 2/27 18.75 6.81 16.50 0 0 West End Park International Cricket Stadium 3 3 55 0 34 3 2/9 11.33 3.70 18.33 0 0 All 126 112 2,250 15 2,072 101 4/6 20.51 5.52 22.27 1 0
Marizanne Kapp: T20I batting by series and tournaments Mat Inns NO Runs HS Avg BF SR 100 50 0 4s 6s ICC Women's T20 World Cup 20 20 3 439 81* 25.82 374 117.37 0 1 1 49 6 South Africa Women tour of West Indies 8 8 0 95 36 11.87 117 81.19 0 0 2 7 1 Women's World T20 7 7 0 85 23 12.14 89 95.50 0 0 1 7 0 Pakistan Women tour of South Africa 6 6 1 115 56* 23.00 121 95.04 0 1 0 9 0 Sri Lanka Women tour of South Africa 5 5 0 136 60 27.20 102 133.33 0 1 0 12 6 ICC Women's World Twenty20 3 3 1 14 9 7.00 26 53.84 0 0 0 0 0 India Women tour of South Africa 3 3 1 31 27 15.50 27 114.81 0 0 0 1 2 PCB Qatar Women's 20-over Tri-Series 3 3 1 70 40 35.00 74 94.59 0 0 0 4 0 South Africa Women tour of Australia 3 3 0 96 75 32.00 71 135.21 0 1 0 13 1 South Africa Women tour of India 3 3 0 87 57 29.00 55 158.18 0 1 0 13 1 South Africa Women tour of Pakistan 3 3 0 59 26 19.66 51 115.68 0 0 0 6 0 Sri Lanka Women in South Africa T20I Series 3 3 0 28 15 9.33 35 80.00 0 0 0 1 0 All 126 104 19 1,774 81* 20.87 1,657 107.06 0 6 6 160 24
Marizanne Kapp: T20I bowling by series and tournaments Mat Inns Balls Mdns Runs Wkts BBI Avg Econ SR 4w 5w ICC Women's T20 World Cup 23 23 505 3 424 25 3/23 16.96 5.03 20.20 0 0 South Africa Women tour of West Indies 9 9 191 1 207 8 3/31 25.87 6.50 23.87 0 0 Pakistan Women tour of South Africa 7 7 150 1 138 7 3/24 19.71 5.52 21.42 0 0 Women's World T20 7 7 142 0 123 9 3/23 13.66 5.19 15.77 0 0 Sri Lanka Women tour of South Africa 5 5 90 0 70 3 1/3 23.33 4.66 30.00 0 0 England Tri-Nation T20 Women's Series 4 4 80 0 134 2 1/30 67.00 10.05 40.00 0 0 India Women tour of South Africa 4 4 78 2 89 2 1/6 44.50 6.84 39.00 0 0 ICC Women's World Twenty20 3 3 60 0 51 1 1/11 51.00 5.10 60.00 0 0 PCB Qatar Women's 20-over Tri-Series 3 3 55 0 34 3 2/9 11.33 3.70 18.33 0 0 South Africa Women in England T20I Series 3 3 45 0 65 1 1/24 65.00 8.66 45.00 0 0 South Africa Women in Sri Lanka T20I Series 3 3 54 0 57 3 2/16 19.00 6.33 18.00 0 0 South Africa Women tour of Australia 3 3 72 0 84 2 1/22 42.00 7.00 36.00 0 0 All 126 112 2,250 15 2,072 101 4/6 20.51 5.52 22.27 1 0
Marizanne Kapp: T20I batting by batting first or chasing Mat Inns NO Runs HS Avg BF SR 100 50 0 4s 6s Batting first 56 56 7 1,001 75 20.42 927 107.98 0 4 6 97 10 Chasing 48 48 12 773 81* 21.47 730 105.89 0 2 0 63 14 All 126 104 19 1,774 81* 20.87 1,657 107.06 0 6 6 160 24
Marizanne Kapp: T20I bowling by bowling first or defending Mat Inns Balls Mdns Runs Wkts BBI Avg Econ SR 4w 5w Bowling first 56 56 1,206 5 1,130 57 4/6 19.82 5.62 21.15 1 0 Defending a total 56 56 1,044 10 942 44 3/3 21.40 5.41 23.72 0 0 All 126 112 2,250 15 2,072 101 4/6 20.51 5.52 22.27 1 0
- not recorded in the scorecards · N/A no dismissals or balls to divide by
Best T20I performances Marizanne Kapp: highest T20I scores Score BF SR 4s 6s Opponent Ground Date 81* 45 180.00 7 4 India Old Trafford 2026-06-21 75 48 156.25 10 1 Australia Bellerive Oval 2024-01-30 60 40 150.00 4 3 Sri Lanka Willowmoore Park 2024-03-27 57 33 172.72 8 1 India MA Chidambaram Stadium 2024-07-05 56* 51 109.80 6 0 Pakistan City Oval 2019-05-18 52 43 120.93 5 0 West Indies Buffalo Park 2023-01-21 44 36 122.22 5 2 Sri Lanka JB Marks Oval 2024-03-30 43 24 179.16 6 0 Scotland Dubai International Cricket Stadium 2024-10-09 40 48 83.33 2 0 Pakistan West End Park International Cricket Stadium 2014-01-24 38 44 86.36 4 1 Sri Lanka Darren Sammy National Cricket Stadium 2018-11-12
Marizanne Kapp: best T20I bowling Figures Balls Mdns Econ Opponent Ground Date 4/6 24 1 1.50 Bangladesh Senwes Park 2013-09-14 3/3 24 2 0.75 West Indies Daren Sammy National Cricket Stadium 2013-01-20 3/16 24 0 4.00 Pakistan Sylhet International Cricket Stadium 2014-03-23 3/17 24 0 4.25 Sri Lanka The Wanderers Stadium 2019-02-03 3/18 24 0 4.50 Sri Lanka Senwes Park 2013-11-02 3/23 24 0 5.75 New Zealand Sylhet International Cricket Stadium 2014-03-31 3/23 24 0 5.75 Pakistan Edgbaston 2026-06-17 3/24 24 0 6.00 Pakistan Kingsmead 2021-01-29 3/31 24 0 7.75 West Indies Sir Vivian Richards Stadium 2021-09-02 2/8 12 0 4.00 Bangladesh Mangaung Oval 2018-05-20
Latest T20I matches Latest T20I matches Date Opponent Bat Bowl Ground Result 2026-07-02 England 5 1/16 Kennington Oval England won by 40 runs 2026-06-28 Bangladesh 16 1/9 Lord's South Africa won by 4 wickets 2026-06-25 Netherlands did not bat 0/11 County Ground, Bristol South Africa won by 88 runs 2026-06-21 India 81* 2/27 Old Trafford South Africa won by 6 wickets 2026-06-17 Pakistan 10 3/23 Edgbaston South Africa won by 2 wickets 2026-06-13 Australia 12 1/29 Old Trafford Australia won by 65 runs 2026-02-16 Pakistan did not bat 0/11 Willowmoore Park Pakistan won by 53 runs 2026-02-13 Pakistan 9 1/25 Willowmoore Park South Africa won by 6 wickets 2025-12-07 Ireland 16 0/4 Boland Park South Africa won by 65 runs 2025-12-05 Ireland did not bat 0/11 Newlands South Africa won by 105 runs
Questions about Marizanne Kapp How many Test runs has Marizanne Kapp scored? Marizanne Kapp has 395 runs in 8 women's Test innings from 4 matches at an average of 56.42 and a strike rate of 60.39. Highest score: 150. Full answer →
How many ODI runs has Marizanne Kapp scored? Marizanne Kapp has 3,511 runs in 139 women's ODI innings from 162 matches at an average of 35.11 and a strike rate of 78.00. Highest score: 121*. Full answer →
What is Marizanne Kapp's ODI batting average? Marizanne Kapp's ODI batting average in women's internationals is 35.11, from 3,511 runs and 139 innings. Full answer →
How many ODI wickets has Marizanne Kapp taken? Marizanne Kapp has taken 181 wickets in women's ODI from 162 matches at a bowling average of 24.24. Best innings: 5/20. Full answer →
How many T20I runs has Marizanne Kapp scored? Marizanne Kapp has 1,774 runs in 104 women's T20I innings from 126 matches at an average of 20.87 and a strike rate of 107.06. Highest score: 81*. Full answer →
What is Marizanne Kapp's T20I batting average? Marizanne Kapp's T20I batting average in women's internationals is 20.87, from 1,774 runs and 104 innings. Full answer →
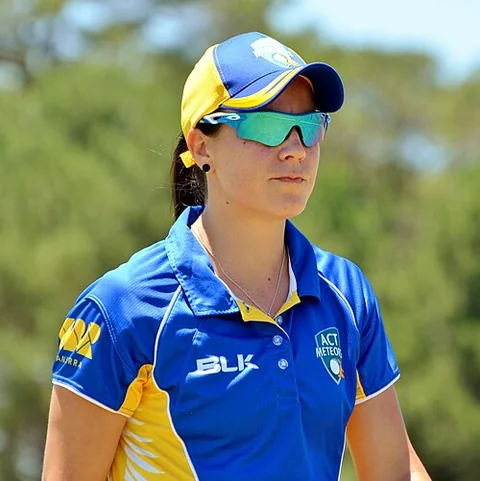

 South AfricaWomenMiddle-order batter2009 to 2026