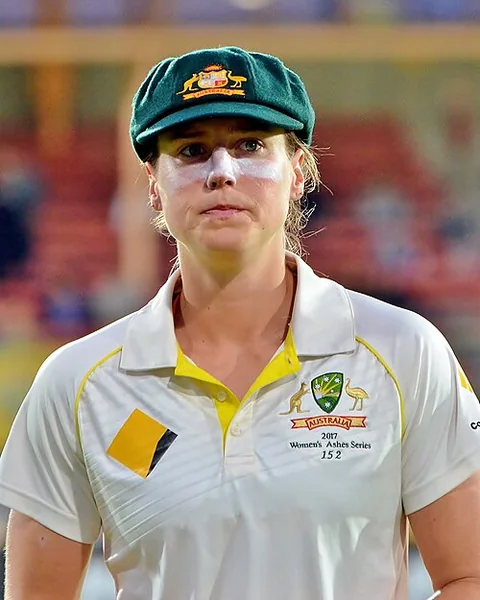
Home / Players / Ellyse Perry ⓘ Ellyse Perry Australia Women All-rounder 2007 to 2026
370 Internationals 2nd among women
8,255 Runs 11th among women
5 Hundreds 29th among women
337 Wickets 4th among women
116 Catches 11th among women
Overview Test15 ODI171 T20I184 Recent scores Oldest on the left. Recorded scorecards only. The top edge marks the result for their side.
Last 12 batting innings 371 Runs
61.83 Average
114.86 Strike rate
Last 12 bowling innings 7 Wickets
2/9 Best
5.37 Economy
Career records by format Batting career records by format Format Mat Inns NO Runs HS Avg BF SR 100s 50s 0s 4s 6s Test 15 24 7 1,006 213* 59.17 2,156 46.66 2 5 0 129 2 ODI 171 143 48 4,691 112* 49.37 5,957 78.74 3 38 7 416 53 T20I 184 126 44 2,558 75 31.19 2,151 118.92 0 12 5 249 50
Bowling career records by format Format Mat Inns Balls Mdns Runs Wkts BBI BBM Avg Econ SR 4w 5w 10w Test 15 23 2,061 79 851 39 6/32 9/70 21.82 2.47 52.84 1 2 0 ODI 171 140 5,836 83 4,253 167 7/22 7/22 25.46 4.37 34.94 1 3 - T20I 184 142 2,495 8 2,430 131 4/12 4/12 18.54 5.84 19.04 4 0 -
Fielding career records by format Format Mat Inns Ct St Dis Dis/inns Best Test 15 29 6 0 6 0.206 2 (2ct 0st) ODI 171 171 59 0 59 0.345 2 (2ct 0st) T20I 184 183 51 0 51 0.278 2 (2ct 0st)
Runs by format
1,006 12% 4,691 57% 2,558 31%
Wickets by format
39 12% 167 50% 131 39%
Career records checked 2026-11-09. Independent of the scorecard archive.
Australia · Compare with another player
Innings explorer 370 scorecards Open explorer
Scorecard coverage Scorecard coverage of the official career Format Official bat inns In scorecards Official bowl inns In scorecards First Latest Coverage Test 24 24 23 23 2008-02-15 2026-03-06 Complete ODI 143 143 140 140 2007-07-22 2026-10-14 Complete T20I 126 126 142 142 2008-02-01 2026-10-20 Complete
1,006 Runs 10th among women
59.17 Bat avg
46.66 Strike rate
39 Wickets 17th among women
21.82 Bowl avg
2.47 Economy
Recent scores Oldest on the left. Recorded scorecards only. The top edge marks the result for their side.
Last 12 batting innings 458 Runs
50.88 Average
49.89 Strike rate
Last 12 bowling innings 18 Wickets
6/32 Best
3.01 Economy
Official Test record Official Test batting record Batting Mat Inns NO Runs HS Avg BF SR 100 50 0 4s 6s Career 15 24 7 1,006 213* 59.17 2,156 46.66 2 5 0 129 2
Official Test bowling record Bowling Mat Inns Balls Mdns Runs Wkts BBI BBM Avg Econ SR 4w 5w 10w Career 15 23 2,061 79 851 39 6/32 9/70 21.82 2.47 52.84 1 2 0
Official Test fielding record Fielding Mat Inns Ct St Dis Dis/Inns Best Career 15 29 6 0 6 0.206 2 (2ct 0st)
Test career in charts Test batting form: average over 10 innings 40 80 120 160 Overall 59.2 Best spell: 128.2 up to 2021-09-30 Best 128.2 Latest: 34.9 2015 2019 2022 2024 2026 Test runs by year 0 60 120 180 2008: 27 runs 2008 2009: 24 runs 2010: 0 runs 2011: 17 runs 2011 2012: 0 runs 2013: 31 runs 2014: 102 runs 2014 2015: 18 runs 2016: 0 runs 2017: 213 runs 2017 2018: 0 runs 2019: 192 runs 2020: 0 runs 2020 2021: 69 runs 2022: 59 runs 2023: 173 runs 2023 2024: 3 runs 2025: 2 runs 2026: 76 runs 2026 Last 20 Test innings
0 1-49 50-99 100+ * not out
Test innings by score How Test innings ended Caught 10 · 41.7%
Bowled 3 · 12.5%
LBW 2 · 8.3%
Run out 1 · 4.2%
Caught and bowled 1 · 4.2%
Not out 7 · 29.2%
Test batting position: average and innings Test runs from boundaries Fours 512 · 50.9%
Sixes 12 · 1.2%
Other runs 482 · 47.9%
Test bowling form: wickets per innings over 10 innings 1 2 Overall 1.70 Best spell: 2.60 up to 2017-11-09 Best 2.60 Latest: 0.90 2014 2017 2021 2023 Test wickets by year 0 3 6 9 2008: 3 wickets 2008 2009: 2 wickets 2010: 0 wickets 2011: 4 wickets 2011 2012: 0 wickets 2013: 1 wicket 2014: 8 wickets 2014 2015: 9 wickets 2016: 0 wickets 2017: 3 wickets 2017 2018: 0 wickets 2019: 1 wicket 2020: 0 wickets 2020 2021: 2 wickets 2022: 4 wickets 2023: 1 wicket 2023 2024: 1 wicket 2024 Last 20 Test bowling innings
Test innings by wickets
Test record by situation complete career Opposition Home and away Match innings Batting position Match result Year Series and tournaments
Ellyse Perry: Test batting by opposition Mat Inns NO Runs HS Avg BF SR 100 50 0 4s 6s England 11 18 5 809 213* 62.23 1,724 46.92 2 3 0 103 1 India 3 5 2 194 76 64.66 426 45.53 0 2 0 25 1 South Africa 1 1 0 3 3 3.00 6 50.00 0 0 0 0 0 All 15 24 7 1,006 213* 59.17 2,156 46.66 2 5 0 128 2
Ellyse Perry: Test bowling by opposition Mat Inns Balls Mdns Runs Wkts BBI Avg Econ SR 4w 5w England 10 18 1,749 73 688 36 6/32 19.11 2.36 48.58 1 2 India 2 3 216 5 121 2 2/76 60.50 3.36 108.00 0 0 South Africa 1 2 96 1 42 1 1/26 42.00 2.62 96.00 0 0 All 15 23 2,061 79 851 39 6/32 21.82 2.47 52.84 1 2
Ellyse Perry: Test batting by home and away Mat Inns NO Runs HS Avg BF SR 100 50 0 4s 6s Home 9 13 4 568 213* 63.11 1,266 44.86 1 3 0 71 2 Away 6 11 3 438 116 54.75 890 49.21 1 2 0 57 0 All 15 24 7 1,006 213* 59.17 2,156 46.66 2 5 0 128 2
Ellyse Perry: Test bowling by home and away Mat Inns Balls Mdns Runs Wkts BBI Avg Econ SR 4w 5w Home 7 14 1,395 50 542 25 5/38 21.68 2.33 55.80 1 1 Away 6 9 666 29 309 14 6/32 22.07 2.78 47.57 0 1 All 15 23 2,061 79 851 39 6/32 21.82 2.47 52.84 1 2
Ellyse Perry: Test batting by match innings Mat Inns NO Runs HS Avg BF SR 100 50 0 4s 6s 1st innings of the match 8 8 2 312 116 52.00 664 46.98 1 1 0 44 0 2nd innings of the match 7 7 3 450 213* 112.50 968 46.48 1 3 0 56 2 3rd innings of the match 7 7 1 212 76* 35.33 456 46.49 0 1 0 24 0 4th innings of the match 2 2 1 32 31 32.00 68 47.05 0 0 0 4 0 All 15 24 7 1,006 213* 59.17 2,156 46.66 2 5 0 128 2
Ellyse Perry: Test bowling by match innings Mat Inns Balls Mdns Runs Wkts BBI Avg Econ SR 4w 5w 1st innings of the match 5 5 618 18 248 12 4/56 20.66 2.40 51.50 1 0 2nd innings of the match 8 8 773 33 358 12 3/38 29.83 2.77 64.41 0 0 3rd innings of the match 5 5 406 14 143 6 5/38 23.83 2.11 67.66 0 1 4th innings of the match 5 5 264 14 102 9 6/32 11.33 2.31 29.33 0 1 All 15 23 2,061 79 851 39 6/32 21.82 2.47 52.84 1 2
Ellyse Perry: Test batting by batting position Mat Inns NO Runs HS Avg BF SR 100 50 0 4s 6s No. 3 4 6 0 252 99 42.00 433 58.19 0 2 0 33 1 No. 4 5 9 4 551 213* 110.20 1,181 46.65 2 2 0 70 1 No. 7 2 4 0 129 71 32.25 339 38.05 0 1 0 17 0 No. 8 2 2 2 49 31* N/A 87 56.32 0 0 0 7 0 No. 10 3 3 1 25 17* 12.50 116 21.55 0 0 0 1 0 All 15 24 7 1,006 213* 59.17 2,156 46.66 2 5 0 128 2
Ellyse Perry: Test batting by match result Mat Inns NO Runs HS Avg BF SR 100 50 0 4s 6s Won 6 8 1 240 99 34.28 485 49.48 0 2 0 30 1 Lost 3 6 0 178 71 29.66 432 41.20 0 1 0 23 0 Drawn 6 10 6 588 213* 147.00 1,239 47.45 2 2 0 75 1 All 15 24 7 1,006 213* 59.17 2,156 46.66 2 5 0 128 2
Ellyse Perry: Test bowling by match result Mat Inns Balls Mdns Runs Wkts BBI Avg Econ SR 4w 5w Won 4 7 610 22 246 15 6/32 16.40 2.41 40.66 1 1 Lost 3 5 492 28 176 11 5/38 16.00 2.14 44.72 0 1 Drawn 6 11 959 29 429 13 3/57 33.00 2.68 73.76 0 0 All 15 23 2,061 79 851 39 6/32 21.82 2.47 52.84 1 2
Ellyse Perry: Test batting by year Mat Inns NO Runs HS Avg BF SR 100 50 0 4s 6s 2008 1 2 0 27 21 13.50 113 23.89 0 0 0 3 0 2009 1 2 1 24 18* 24.00 82 29.26 0 0 0 3 0 2011 1 1 1 17 17* N/A 90 18.88 0 0 0 1 0 2013 1 1 1 31 31* N/A 24 129.16 0 0 0 4 0 2014 1 2 0 102 71 51.00 226 45.13 0 1 0 14 0 2015 1 2 0 18 13 9.00 48 37.50 0 0 0 2 0 2017 1 1 1 213 213* N/A 374 56.95 1 0 0 26 1 2019 1 2 1 192 116 192.00 425 45.17 1 1 0 25 0 2021 1 2 2 69 68* N/A 217 31.79 0 1 0 9 0 2022 1 2 0 59 41 29.50 117 50.42 0 0 0 8 0 2023 2 4 0 173 99 43.25 311 55.62 0 1 0 23 0 2024 1 1 0 3 3 3.00 6 50.00 0 0 0 0 0 2025 1 1 0 2 2 2.00 7 28.57 0 0 0 0 0 2026 1 1 0 76 76 76.00 116 65.51 0 1 0 10 1 All 15 24 7 1,006 213* 59.17 2,156 46.66 2 5 0 128 2
Ellyse Perry: Test bowling by year Mat Inns Balls Mdns Runs Wkts BBI Avg Econ SR 4w 5w 2008 1 2 216 16 66 3 2/49 22.00 1.83 72.00 0 0 2009 1 2 120 3 63 2 1/14 31.50 3.15 60.00 0 0 2011 1 2 274 9 95 4 4/56 23.75 2.08 68.50 1 0 2013 1 2 204 11 62 1 1/51 62.00 1.82 204.00 0 0 2014 1 2 252 12 79 8 5/38 9.87 1.88 31.50 0 1 2015 1 2 180 10 70 9 6/32 7.77 2.33 20.00 0 1 2017 1 2 210 5 85 3 3/59 28.33 2.42 70.00 0 0 2019 1 1 78 3 44 1 1/44 44.00 3.38 78.00 0 0 2021 1 2 192 5 90 2 2/76 45.00 2.81 96.00 0 0 2022 1 2 155 2 85 4 3/57 21.25 3.29 38.75 0 0 2023 2 2 84 2 70 1 1/39 70.00 5.00 84.00 0 0 2024 1 2 96 1 42 1 1/26 42.00 2.62 96.00 0 0 All 15 23 2,061 79 851 39 6/32 21.82 2.47 52.84 1 2
Ellyse Perry: Test batting by series and tournaments Mat Inns NO Runs HS Avg BF SR 100 50 0 4s 6s Women's Ashes 6 9 2 447 213* 63.85 788 56.72 1 1 0 57 1 Australia Women tour of England 2 4 2 216 116 108.00 507 42.60 1 1 0 28 0 India Women tour of Australia 2 3 2 145 76 145.00 333 43.54 0 2 0 19 1 All 15 24 7 1,006 213* 59.17 2,156 46.66 2 5 0 128 2
Ellyse Perry: Test bowling by series and tournaments Mat Inns Balls Mdns Runs Wkts BBI Avg Econ SR 4w 5w Women's Ashes 5 9 809 30 341 18 6/32 18.94 2.52 44.94 0 1 Australia Women tour of England 2 3 198 6 107 3 1/14 35.66 3.24 66.00 0 0 All 15 23 2,061 79 851 39 6/32 21.82 2.47 52.84 1 2
- not recorded in the scorecards · N/A no dismissals or balls to divide by
Best Test performances Ellyse Perry: highest Test scores Score BF SR 4s 6s Opponent Ground Date 213* 374 56.95 26 1 England North Sydney Oval 2017-11-09 116 281 41.28 16 0 England The County Ground 2019-07-18 99 153 64.70 15 0 England Trent Bridge 2023-06-22 76* 144 52.77 9 0 England The County Ground 2019-07-18 76 116 65.51 10 1 India WACA 2026-03-06 71 172 41.27 10 0 England WACA Ground 2014-01-10 68* 203 33.49 9 0 India Metricon Stadium 2021-09-30 45 91 49.45 5 0 India Wankhede Stadium 2023-12-21 41 83 49.39 5 0 England Manuka Oval 2022-01-27 31* 24 129.16 4 0 England Sir Paul Getty's Ground 2013-08-11
Ellyse Perry: best Test bowling Figures Balls Mdns Econ Opponent Ground Date 6/32 78 5 2.46 England St Lawrence Ground 2015-08-11 5/38 120 6 1.90 England WACA Ground 2014-01-10 4/56 168 6 2.00 England Bankstown Oval 2011-01-22 3/38 102 5 2.23 England St Lawrence Ground 2015-08-11 3/41 132 6 1.86 England WACA Ground 2014-01-10 3/57 125 2 2.73 England Manuka Oval 2022-01-27 3/59 126 2 2.80 England North Sydney Oval 2017-11-09 2/49 138 10 2.13 England Bradman Oval 2008-02-15 2/76 162 4 2.81 India Metricon Stadium 2021-09-30 1/14 48 2 1.75 England New Road, Worcester 2009-07-10
Latest Test matches Latest Test matches Date Opponent Bat Bowl Ground Result 2026-03-06 India 76 - WACA Australia won by 10 wickets 2025-01-30 England 2 - Melbourne Cricket Ground Australia won by an innings and 122 runs 2024-02-15 South Africa 3 0/16 & 1/26 WACA Australia won by an innings and 284 runs 2023-12-21 India 4 & 45 0/31 Wankhede Stadium India won by 8 wickets 2023-06-22 England 99 & 25 1/39 Trent Bridge Australia won by 89 runs 2022-01-27 England 18 & 41 3/57 & 1/28 Manuka Oval Match drawn 2021-09-30 India 68* & 1* 2/76 & 0/14 Metricon Stadium Match drawn 2019-07-18 England 116 & 76* 1/44 The County Ground Match drawn 2017-11-09 England 213* 3/59 & 0/26 North Sydney Oval Match drawn 2015-08-11 England 5 & 13 3/38 & 6/32 St Lawrence Ground Australia won by 161 runs
4,691 Runs 10th among women
49.37 Bat avg
78.74 Strike rate
167 Wickets 8th among women
25.46 Bowl avg
4.37 Economy
Recent scores Oldest on the left. Recorded scorecards only. The top edge marks the result for their side.
Last 12 batting innings 362 Runs
51.71 Average
83.21 Strike rate
Last 12 bowling innings 5 Wickets
2/17 Best
4.43 Economy
Official ODI record Official ODI batting record Batting Mat Inns NO Runs HS Avg BF SR 100 50 0 4s 6s Career 171 143 48 4,691 112* 49.37 5,957 78.74 3 38 7 416 53
Official ODI bowling record Bowling Mat Inns Balls Mdns Runs Wkts BBI BBM Avg Econ SR 4w 5w 10w Career 171 140 5,836 83 4,253 167 7/22 7/22 25.46 4.37 34.94 1 3 -
Official ODI fielding record Fielding Mat Inns Ct St Dis Dis/Inns Best Career 171 171 59 0 59 0.345 2 (2ct 0st)
ODI career in charts ODI batting form: average over 20 innings 30 60 90 120 Overall 49.4 Best spell: 94.0 up to 2016-11-27 Best 94.0 Latest: 44.5 2009 2012 2015 2018 2022 2025 ODI runs by year 0 200 400 600 2007: 27 runs 2007 2008: 143 runs 2009: 141 runs 2010: 90 runs 2010 2011: 7 runs 2012: 34 runs 2013: 113 runs 2013 2014: 418 runs 2015: 193 runs 2016: 732 runs 2016 2017: 515 runs 2018: 168 runs 2019: 441 runs 2019 2020: 0 runs 2021: 113 runs 2022: 234 runs 2022 2023: 467 runs 2024: 275 runs 2025: 393 runs 2025 2026: 187 runs 2026 Last 20 ODI innings
0 1-49 50-99 100+ * not out
ODI innings by score How ODI innings ended Caught 51 · 35.7%
Bowled 15 · 10.5%
LBW 7 · 4.9%
Run out 9 · 6.3%
Stumped 7 · 4.9%
Caught and bowled 6 · 4.2%
Not out 48 · 33.6%
ODI batting position: average and innings ODI runs from boundaries Fours 1,664 · 35.5%
Sixes 318 · 6.8%
Other runs 2,709 · 57.7%
ODI bowling form: wickets per innings over 20 innings 1 Overall 1.19 Best spell: 1.85 up to 2013-02-03 Best 1.85 Latest: 0.50 2009 2012 2015 2018 2022 2025 ODI wickets by year 0 6 12 18 2007: 4 wickets 2007 2008: 19 wickets 2009: 13 wickets 2010: 18 wickets 2010 2011: 1 wicket 2012: 15 wickets 2013: 9 wickets 2013 2014: 10 wickets 2015: 3 wickets 2016: 20 wickets 2016 2017: 14 wickets 2018: 5 wickets 2019: 21 wickets 2019 2020: 0 wickets 2021: 0 wickets 2022: 9 wickets 2022 2023: 1 wicket 2024: 4 wickets 2025: 0 wickets 2025 2026: 1 wicket 2026 Last 20 ODI bowling innings
ODI innings by wickets
ODI record by situation complete career Opposition Home and away Batting first or chasing Batting position Match result Year Ground Series and tournaments Bowling first or defending
Ellyse Perry: ODI batting by opposition Mat Inns NO Runs HS Avg BF SR 100 50 0 4s 6s England 35 35 8 1,138 91 42.14 1,442 78.91 0 10 2 108 13 New Zealand 32 32 10 905 107* 41.13 1,221 74.11 1 7 1 79 7 India 27 27 6 988 105 47.04 1,201 82.26 1 8 1 88 18 West Indies 16 16 10 643 112* 107.16 748 85.96 1 4 1 51 7 Pakistan 10 10 3 167 66 23.85 280 59.64 0 1 1 9 1 South Africa 10 10 4 424 95* 70.66 554 76.53 0 5 1 41 3 Bangladesh 6 6 5 174 65* 174.00 219 79.45 0 1 0 19 0 Sri Lanka 6 6 2 161 77* 40.25 193 83.41 0 1 0 12 1 Ireland 1 1 0 91 91 91.00 99 91.91 0 1 0 9 3 All 171 143 48 4,691 112* 49.37 5,957 78.74 3 38 7 416 53
Ellyse Perry: ODI bowling by opposition Mat Inns Balls Mdns Runs Wkts BBI Avg Econ SR 4w 5w New Zealand 41 41 1,747 20 1,309 43 5/31 30.44 4.49 40.62 0 1 England 32 32 1,446 19 1,107 40 7/22 27.67 4.59 36.15 0 1 India 25 25 1,082 19 838 32 5/19 26.18 4.64 33.81 1 1 West Indies 11 11 515 9 300 23 3/17 13.04 3.49 22.39 0 0 Pakistan 10 10 362 6 204 6 2/16 34.00 3.38 60.33 0 0 South Africa 10 10 366 4 311 13 3/35 23.92 5.09 28.15 0 0 Sri Lanka 7 7 222 4 141 7 2/28 20.14 3.81 31.71 0 0 Bangladesh 4 4 96 2 43 3 2/17 14.33 2.68 32.00 0 0 All 171 140 5,836 83 4,253 167 7/22 25.46 4.37 34.94 1 3
Ellyse Perry: ODI batting by home and away Mat Inns NO Runs HS Avg BF SR 100 50 0 4s 6s Home 62 62 23 1,966 107* 50.41 2,474 79.46 2 16 4 159 23 Away 59 59 17 2,165 112* 51.54 2,689 80.51 1 18 1 207 27 Neutral 22 22 8 560 71 40.00 794 70.52 0 4 2 50 3 All 171 143 48 4,691 112* 49.37 5,957 78.74 3 38 7 416 53
Ellyse Perry: ODI bowling by home and away Mat Inns Balls Mdns Runs Wkts BBI Avg Econ SR 4w 5w Home 68 68 2,902 47 2,134 89 5/31 23.97 4.41 32.60 1 1 Away 53 53 2,050 24 1,495 56 7/22 26.69 4.37 36.60 0 2 Neutral 19 19 884 12 624 22 3/19 28.36 4.23 40.18 0 0 All 171 140 5,836 83 4,253 167 7/22 25.46 4.37 34.94 1 3
Ellyse Perry: ODI batting by batting first or chasing Mat Inns NO Runs HS Avg BF SR 100 50 0 4s 6s Batting first 80 80 19 2,770 112* 45.40 3,369 82.22 3 23 5 242 36 Chasing 63 63 29 1,921 93* 56.50 2,588 74.22 0 15 2 174 17 All 171 143 48 4,691 112* 49.37 5,957 78.74 3 38 7 416 53
Ellyse Perry: ODI bowling by bowling first or defending Mat Inns Balls Mdns Runs Wkts BBI Avg Econ SR 4w 5w Bowling first 71 71 2,947 38 2,330 73 5/31 31.91 4.74 40.36 0 1 Defending a total 69 69 2,889 45 1,923 94 7/22 20.45 3.99 30.73 1 2 All 171 140 5,836 83 4,253 167 7/22 25.46 4.37 34.94 1 3
Ellyse Perry: ODI batting by batting position Mat Inns NO Runs HS Avg BF SR 100 50 0 4s 6s No. 3 46 46 12 1,832 112* 53.88 2,205 83.08 2 14 2 175 32 No. 4 52 52 19 1,976 107* 59.87 2,669 74.03 1 19 1 170 16 No. 5 8 8 5 357 90* 119.00 356 100.28 0 4 1 31 4 No. 6 3 3 0 42 24 14.00 60 70.00 0 0 0 4 0 No. 7 14 14 3 165 51 15.00 302 54.63 0 1 2 9 0 No. 8 11 11 3 165 36 20.62 216 76.38 0 0 1 15 0 No. 9 7 7 4 131 33* 43.66 134 97.76 0 0 0 10 1 No. 10 2 2 2 23 16* N/A 15 153.33 0 0 0 2 0 All 171 143 48 4,691 112* 49.37 5,957 78.74 3 38 7 416 53
Ellyse Perry: ODI batting by match result Mat Inns NO Runs HS Avg BF SR 100 50 0 4s 6s Won 112 112 43 3,719 112* 53.89 4,576 81.27 3 29 5 334 46 Lost 30 30 5 903 78 36.12 1,282 70.43 0 8 2 76 7 Tied 1 1 0 69 69 69.00 99 69.69 0 1 0 6 0 All 171 143 48 4,691 112* 49.37 5,957 78.74 3 38 7 416 53
Ellyse Perry: ODI bowling by match result Mat Inns Balls Mdns Runs Wkts BBI Avg Econ SR 4w 5w Won 109 109 4,520 71 3,122 143 7/22 21.83 4.14 31.60 1 3 Lost 29 29 1,232 12 1,043 23 3/40 45.34 5.07 53.56 0 0 Tied 1 1 54 0 58 1 1/58 58.00 6.44 54.00 0 0 No result 1 1 30 0 30 0 0/30 N/A 6.00 N/A 0 0 All 171 140 5,836 83 4,253 167 7/22 25.46 4.37 34.94 1 3
Ellyse Perry: ODI batting by year Mat Inns NO Runs HS Avg BF SR 100 50 0 4s 6s 2007 3 3 0 27 19 9.00 36 75.00 0 0 1 1 0 2008 9 9 2 143 51 20.42 266 53.75 0 1 0 8 0 2009 11 11 4 141 36 20.14 206 68.44 0 0 1 12 0 2010 5 5 2 90 30 30.00 81 111.11 0 0 0 8 0 2011 1 1 1 7 7* N/A 6 116.66 0 0 0 0 0 2012 2 2 1 34 33* 34.00 31 109.67 0 0 0 3 0 2013 6 6 3 113 45* 37.66 138 81.88 0 0 1 10 2 2014 7 7 4 418 90* 139.33 506 82.60 0 6 1 31 3 2015 3 3 0 193 78 64.33 225 85.77 0 2 0 22 0 2016 13 13 4 732 95* 81.33 941 77.78 0 9 0 65 7 2017 12 12 3 515 71 57.22 684 75.29 0 6 0 41 6 2018 6 6 2 168 70* 42.00 253 66.40 0 1 0 10 3 2019 11 11 5 441 112* 73.50 544 81.06 2 2 0 36 3 2021 5 5 1 113 56* 28.25 172 65.69 0 1 0 10 0 2022 9 9 4 234 68 46.80 327 71.55 0 1 1 22 3 2023 10 10 3 467 91 66.71 513 91.03 0 5 0 52 9 2024 12 12 3 275 105 30.55 316 87.02 1 0 0 29 6 2025 12 12 2 393 77 39.30 494 79.55 0 3 1 41 8 2026 6 6 4 187 65* 93.50 218 85.77 0 1 1 15 3 All 171 143 48 4,691 112* 49.37 5,957 78.74 3 38 7 416 53
Ellyse Perry: ODI bowling by year Mat Inns Balls Mdns Runs Wkts BBI Avg Econ SR 4w 5w 2007 4 4 168 1 122 4 2/37 30.50 4.35 42.00 0 0 2008 13 13 605 13 409 19 3/21 21.52 4.05 31.84 0 0 2009 13 13 539 7 421 13 3/40 32.38 4.68 41.46 0 0 2010 8 8 391 6 282 18 5/31 15.66 4.32 21.72 0 1 2011 3 3 156 2 105 1 1/21 105.00 4.03 156.00 0 0 2012 8 8 404 7 253 15 5/19 16.86 3.75 26.93 0 1 2013 7 7 346 5 237 9 3/19 26.33 4.10 38.44 0 0 2014 7 7 377 5 308 10 3/23 30.80 4.90 37.70 0 0 2015 3 3 138 2 80 3 2/16 26.66 3.47 46.00 0 0 2016 13 13 612 5 488 20 4/45 24.40 4.78 30.60 1 0 2017 13 13 646 6 499 14 3/47 35.64 4.63 46.14 0 0 2018 6 6 278 4 205 5 2/40 41.00 4.42 55.60 0 0 2019 12 12 450 13 284 21 7/22 13.52 3.78 21.42 0 1 2021 5 5 120 0 134 0 0/15 N/A 6.70 N/A 0 0 2022 9 9 294 4 183 9 3/12 20.33 3.73 32.66 0 0 2023 4 4 90 0 79 1 1/38 79.00 5.26 90.00 0 0 2024 9 9 162 3 124 4 2/17 31.00 4.59 40.50 0 0 2025 2 2 30 0 30 0 0/15 N/A 6.00 N/A 0 0 2026 1 1 30 0 10 1 1/10 10.00 2.00 30.00 0 0 All 171 140 5,836 83 4,253 167 7/22 25.46 4.37 34.94 1 3
Ellyse Perry: ODI batting by ground Mat Inns NO Runs HS Avg BF SR 100 50 0 4s 6s Allan Border Field 10 10 5 282 105 56.40 302 93.37 1 1 0 24 7 Bay Oval 8 8 3 262 64* 52.40 360 72.77 0 3 0 25 3 The County Ground 8 8 2 280 78 46.66 346 80.92 0 3 0 32 3 North Sydney Oval 7 7 2 105 33* 21.00 149 70.46 0 0 1 11 0 County Ground, Bristol 6 6 2 329 71 82.25 419 78.52 0 3 0 27 2 Sydney Cricket Ground 6 6 1 59 36 11.80 68 86.76 0 0 0 5 0 Junction Oval 5 5 3 214 60 107.00 280 76.42 0 2 0 20 5 Manuka Oval 5 5 3 292 95* 146.00 379 77.04 0 3 1 22 3 Melbourne Cricket Ground 5 5 2 157 65* 52.33 181 86.74 0 1 1 9 0 Basin Reserve 4 4 0 121 68 30.25 172 70.34 0 1 0 12 1 Bellerive Oval 4 4 1 173 90* 57.66 231 74.89 0 2 0 14 1 Lincoln 4 4 1 80 51 26.66 158 50.63 0 1 0 7 0 Adelaide Oval 3 3 2 27 16* 27.00 47 57.44 0 0 0 3 0 Grace Road 3 3 0 131 66 43.66 190 68.94 0 2 0 14 0 Holkar Cricket Stadium 3 3 0 46 33 15.33 66 69.69 0 0 1 8 0 All 171 143 48 4,691 112* 49.37 5,957 78.74 3 38 7 416 53
Ellyse Perry: ODI bowling by ground Mat Inns Balls Mdns Runs Wkts BBI Avg Econ SR 4w 5w Sydney Cricket Ground 9 9 420 12 228 17 3/16 13.41 3.25 24.70 0 0 Allan Border Field 8 8 234 3 148 5 2/50 29.60 3.79 46.80 0 0 Bay Oval 8 8 306 3 243 3 1/9 81.00 4.76 102.00 0 0 Melbourne Cricket Ground 7 7 339 6 275 15 5/31 18.33 4.86 22.60 0 1 North Sydney Oval 7 7 282 1 245 6 3/40 40.83 5.21 47.00 0 0 The County Ground 7 7 332 3 279 7 3/47 39.85 5.04 47.42 0 0 County Ground, Bristol 6 6 282 3 247 5 2/37 49.40 5.25 56.40 0 0 Manuka Oval 6 6 270 5 167 10 4/45 16.70 3.71 27.00 1 0 Basin Reserve 5 5 126 0 81 5 3/22 16.20 3.85 25.20 0 0 Lincoln 5 5 209 1 164 4 2/51 41.00 4.70 52.25 0 0 Marrara Cricket Ground 4 4 168 1 122 4 2/37 30.50 4.35 42.00 0 0 Adelaide Oval 3 3 100 3 75 5 2/25 15.00 4.50 20.00 0 0 Barabati Stadium 3 3 152 2 103 5 3/35 20.60 4.06 30.40 0 0 Bellerive Oval 3 3 180 4 165 6 3/54 27.50 5.50 30.00 0 0 Grace Road 3 3 150 1 107 4 3/43 26.75 4.28 37.50 0 0 All 171 140 5,836 83 4,253 167 7/22 25.46 4.37 34.94 1 3
Ellyse Perry: ODI batting by series and tournaments Mat Inns NO Runs HS Avg BF SR 100 50 0 4s 6s ICC Women's Championship 22 22 8 1,092 95* 78.00 1,422 76.79 0 13 0 90 10 ICC Women's World Cup 21 21 8 767 77 59.00 976 78.58 0 7 1 69 8 Women's Ashes 15 15 4 561 91 51.00 707 79.34 0 5 2 54 8 Australia Women tour of India 6 6 1 283 75 56.60 299 94.64 0 3 0 32 6 Australia Women tour of New Zealand 5 5 1 128 56* 32.00 173 73.98 0 1 0 14 0 India Women tour of Australia 5 5 0 138 105 27.60 147 93.87 1 0 0 9 6 Rose Bowl 5 5 3 201 107* 100.50 248 81.04 1 1 0 16 3 Australia Women tour of West Indies 4 4 2 110 44 55.00 118 93.22 0 0 1 5 3 Australia Women tour of Bangladesh 3 3 2 64 35* 64.00 88 72.72 0 0 0 7 0 Australia Women tour of England 3 3 0 72 62 24.00 110 65.45 0 1 0 9 0 Bangladesh Women tour of Australia 3 3 3 110 65* N/A 131 83.96 0 1 0 12 0 South Africa Women tour of Australia 3 3 1 42 24 21.00 71 59.15 0 0 0 6 0 All 171 143 48 4,691 112* 49.37 5,957 78.74 3 38 7 416 53
Ellyse Perry: ODI bowling by series and tournaments Mat Inns Balls Mdns Runs Wkts BBI Avg Econ SR 4w 5w ICC Women's Championship 22 22 978 15 676 20 3/42 33.80 4.14 48.90 0 0 ICC Women's World Cup 15 15 672 8 492 17 3/19 28.94 4.39 39.52 0 0 Women's Ashes 10 10 440 5 363 9 3/12 40.33 4.95 48.88 0 0 Rose Bowl 7 7 306 6 218 6 2/39 36.33 4.27 51.00 0 0 India Women tour of Australia 5 5 126 0 146 0 0/13 N/A 6.95 N/A 0 0 Australia Women tour of New Zealand 4 4 66 0 54 1 1/15 54.00 4.90 66.00 0 0 Australia Women tour of Bangladesh 3 3 66 2 33 2 2/17 16.50 3.00 33.00 0 0 Australia Women tour of England 3 3 150 5 105 11 7/22 9.54 4.20 13.63 0 1 Pakistan Women tour of Australia 3 3 66 0 41 0 0/12 N/A 3.72 N/A 0 0 All 171 140 5,836 83 4,253 167 7/22 25.46 4.37 34.94 1 3
Ellyse Perry: ODI batting by batting first or chasing Mat Inns NO Runs HS Avg BF SR 100 50 0 4s 6s Batting first 80 80 19 2,770 112* 45.40 3,369 82.22 3 23 5 242 36 Chasing 63 63 29 1,921 93* 56.50 2,588 74.22 0 15 2 174 17 All 171 143 48 4,691 112* 49.37 5,957 78.74 3 38 7 416 53
Ellyse Perry: ODI bowling by bowling first or defending Mat Inns Balls Mdns Runs Wkts BBI Avg Econ SR 4w 5w Bowling first 71 71 2,947 38 2,330 73 5/31 31.91 4.74 40.36 0 1 Defending a total 69 69 2,889 45 1,923 94 7/22 20.45 3.99 30.73 1 2 All 171 140 5,836 83 4,253 167 7/22 25.46 4.37 34.94 1 3
- not recorded in the scorecards · N/A no dismissals or balls to divide by
Best ODI performances Ellyse Perry: highest ODI scores Score BF SR 4s 6s Opponent Ground Date 112* 118 94.91 9 0 West Indies Sir Vivian Richards Stadium 2019-09-08 107* 110 97.27 8 3 New Zealand Karen Rolton Oval 2019-02-24 105 75 140.00 7 6 India Allan Border Field 2024-12-08 95* 129 73.64 8 0 South Africa Manuka Oval 2016-11-20 93* 107 86.91 6 2 South Africa Manuka Oval 2016-11-18 91 124 73.38 9 1 England The Rose Bowl 2023-07-16 91 99 91.91 9 3 Ireland Clontarf Cricket Club Ground 2023-07-25 90* 95 94.73 7 1 England Bellerive Oval 2014-01-26 90 118 76.27 7 1 India Manuka Oval 2016-02-02 78 96 81.25 12 0 England The County Ground 2015-07-21
Ellyse Perry: best ODI bowling Figures Balls Mdns Econ Opponent Ground Date 7/22 60 4 2.20 England St Lawrence Ground 2019-07-07 5/19 49 3 2.32 India Wankhede Stadium 2012-03-14 5/31 57 2 3.26 New Zealand Melbourne Cricket Ground 2010-02-17 4/45 60 0 4.50 India Manuka Oval 2016-02-02 3/12 42 1 1.71 England Junction Oval 2022-02-06 3/16 49 2 1.95 New Zealand Sydney Cricket Ground 2012-01-29 3/17 30 0 3.40 West Indies Coolidge Cricket Ground 2019-09-05 3/19 60 3 1.90 West Indies Brabourne Stadium 2013-02-17 3/21 54 3 2.33 India Manuka Oval 2008-11-08 3/22 48 0 2.75 West Indies Basin Reserve 2022-03-15
Latest ODI matches Latest ODI matches Date Opponent Bat Bowl Ground Result 2026-10-14 Bangladesh 65* 1/10 Allan Border Field Australia won by 8 wickets 2026-10-11 Bangladesh 19* - Allan Border Field Australia won by 9 wickets 2026-10-09 Bangladesh 26* - Allan Border Field Australia won by 7 wickets 2026-04-02 West Indies 33* - Warner Park Australia won by 9 wickets 2026-03-29 West Indies 0 - Warner Park Australia won by 90 runs 2026-03-27 West Indies 44 - Warner Park Australia won by 103 runs 2025-10-30 India 77 - Dr DY Patil Sports Academy India won by 5 wickets 2025-10-25 South Africa 0 - Holkar Cricket Stadium Australia won by 7 wickets 2025-10-22 England 13 - Holkar Cricket Stadium Australia won by 6 wickets 2025-10-16 Bangladesh v Australia did not bat - Andhra Cricket Association-Visakhapatnam District Cricket Association Stadium Australia won by 10 wickets
2,558 Runs 25th among women
31.19 Average
118.92 Strike rate
0 Hundreds
12 Fifties
75 Highest
Recent scores Oldest on the left. Recorded scorecards only. The top edge marks the result for their side.
Last 12 batting innings 357 Runs
39.66 Average
133.70 Strike rate
Last 12 bowling innings 9 Wickets
2/9 Best
5.55 Economy
Official T20I record Official T20I batting record Batting Mat Inns NO Runs HS Avg BF SR 100 50 0 4s 6s Career 184 126 44 2,558 75 31.19 2,151 118.92 0 12 5 249 50
Official T20I bowling record Bowling Mat Inns Balls Mdns Runs Wkts BBI BBM Avg Econ SR 4w 5w 10w Career 184 142 2,495 8 2,430 131 4/12 4/12 18.54 5.84 19.04 4 0 -
Official T20I fielding record Fielding Mat Inns Ct St Dis Dis/Inns Best Career 184 183 51 0 51 0.278 2 (2ct 0st)
T20I career in charts T20I batting form: average over 20 innings 20 40 60 Overall 31.2 Best spell: 48.5 up to 2020-02-09 Best 48.5 Latest: 33.1 2014 2017 2020 2023 2026 T20I runs by year 0 100 200 300 2008: 32 runs 2008 2009: 4 runs 2010: 27 runs 2011: 8 runs 2011 2012: 25 runs 2013: 48 runs 2014: 187 runs 2014 2015: 164 runs 2016: 302 runs 2017: 28 runs 2017 2018: 126 runs 2019: 150 runs 2020: 117 runs 2020 2021: 35 runs 2022: 165 runs 2023: 319 runs 2023 2024: 351 runs 2025: 85 runs 2026: 385 runs 2026 Last 20 T20I innings
0 1-49 50-99 100+ * not out
T20I innings by score How T20I innings ended Caught 46 · 36.5%
Bowled 14 · 11.1%
LBW 8 · 6.3%
Run out 8 · 6.3%
Stumped 3 · 2.4%
Caught and bowled 3 · 2.4%
Not out 44 · 34.9%
T20I batting position: average and innings T20I runs from boundaries Fours 996 · 38.9%
Sixes 300 · 11.7%
Other runs 1,262 · 49.3%
T20I bowling form: wickets per innings over 20 innings 1 Overall 0.92 Best spell: 1.30 up to 2016-03-18 Best 1.30 Latest: 0.70 2010 2013 2016 2019 2022 2025 T20I wickets by year 0 5 10 15 20 2008: 5 wickets 2008 2009: 4 wickets 2010: 16 wickets 2011: 4 wickets 2011 2012: 14 wickets 2013: 4 wickets 2014: 15 wickets 2014 2015: 5 wickets 2016: 10 wickets 2017: 3 wickets 2017 2018: 20 wickets 2019: 6 wickets 2020: 8 wickets 2020 2021: 1 wicket 2022: 2 wickets 2023: 6 wickets 2023 2024: 3 wickets 2025: 0 wickets 2026: 5 wickets 2026 Last 20 T20I bowling innings
T20I innings by wickets
T20I record by situation complete career Opposition Home and away Batting first or chasing Batting position Match result Year Ground Series and tournaments Bowling first or defending
Ellyse Perry: T20I batting by opposition Mat Inns NO Runs HS Avg BF SR 100 50 0 4s 6s England 29 29 12 543 60* 31.94 489 111.04 0 2 1 47 10 New Zealand 27 27 9 558 55* 31.00 464 120.25 0 2 1 59 8 India 24 24 5 546 75 28.73 424 128.77 0 4 2 56 17 West Indies 15 15 4 294 70 26.72 255 115.29 0 1 0 23 10 South Africa 10 10 2 164 41* 20.50 136 120.58 0 0 1 19 0 Pakistan 9 9 6 220 71 73.33 173 127.16 0 2 0 22 4 Ireland 5 5 3 149 55* 74.50 136 109.55 0 1 0 15 1 Bangladesh 3 3 1 56 29 28.00 48 116.66 0 0 0 5 0 Sri Lanka 3 3 2 27 17 27.00 23 117.39 0 0 0 3 0 Netherlands 1 1 0 1 1 1.00 3 33.33 0 0 0 0 0 All 184 126 44 2,558 75 31.19 2,151 118.92 0 12 5 249 50
Ellyse Perry: T20I bowling by opposition Mat Inns Balls Mdns Runs Wkts BBI Avg Econ SR 4w 5w England 34 34 637 0 722 30 4/20 24.06 6.80 21.23 1 0 New Zealand 34 34 690 1 696 34 4/21 20.47 6.05 20.29 1 0 India 25 25 415 3 386 24 4/12 16.08 5.58 17.29 2 0 West Indies 15 15 243 2 208 14 3/9 14.85 5.13 17.35 0 0 Pakistan 9 9 114 2 96 10 3/12 9.60 5.05 11.40 0 0 South Africa 8 8 108 0 90 7 2/13 12.85 5.00 15.42 0 0 Sri Lanka 7 7 126 0 118 4 2/21 29.50 5.61 31.50 0 0 Bangladesh 5 5 66 0 48 3 2/14 16.00 4.36 22.00 0 0 Ireland 5 5 96 0 66 5 2/12 13.20 4.12 19.20 0 0 All 184 142 2,495 8 2,430 131 4/12 18.54 5.84 19.04 4 0
Ellyse Perry: T20I batting by home and away Mat Inns NO Runs HS Avg BF SR 100 50 0 4s 6s Home 46 46 13 773 70 23.42 674 114.68 0 4 1 78 12 Away 47 47 17 1,079 75 35.96 881 122.47 0 6 3 104 24 Neutral 33 33 14 706 71 37.15 596 118.45 0 2 1 67 14 All 184 126 44 2,558 75 31.19 2,151 118.92 0 12 5 249 50
Ellyse Perry: T20I bowling by home and away Mat Inns Balls Mdns Runs Wkts BBI Avg Econ SR 4w 5w Home 53 53 947 3 920 54 4/12 17.03 5.82 17.53 4 0 Away 47 47 834 4 775 37 3/14 20.94 5.57 22.54 0 0 Neutral 42 42 714 1 735 40 3/12 18.37 6.17 17.85 0 0 All 184 142 2,495 8 2,430 131 4/12 18.54 5.84 19.04 4 0
Ellyse Perry: T20I batting by batting first or chasing Mat Inns NO Runs HS Avg BF SR 100 50 0 4s 6s Batting first 77 77 20 1,611 75 28.26 1,357 118.71 0 7 2 144 34 Chasing 49 49 24 947 60* 37.88 794 119.26 0 5 3 105 16 All 184 126 44 2,558 75 31.19 2,151 118.92 0 12 5 249 50
Ellyse Perry: T20I bowling by bowling first or defending Mat Inns Balls Mdns Runs Wkts BBI Avg Econ SR 4w 5w Bowling first 65 65 1,197 5 1,087 67 4/13 16.22 5.44 17.86 2 0 Defending a total 77 77 1,298 3 1,343 64 4/12 20.98 6.20 20.28 2 0 All 184 142 2,495 8 2,430 131 4/12 18.54 5.84 19.04 4 0
Ellyse Perry: T20I batting by batting position Mat Inns NO Runs HS Avg BF SR 100 50 0 4s 6s No. 1 1 1 1 57 57* N/A 40 142.50 0 1 0 7 1 No. 2 5 5 2 150 55* 50.00 136 110.29 0 1 0 21 0 No. 3 16 16 5 399 71 36.27 335 119.10 0 3 1 46 7 No. 4 48 48 15 1,094 75 33.15 929 117.76 0 5 1 108 24 No. 5 22 22 7 510 72* 34.00 401 127.18 0 2 0 43 13 No. 6 17 17 6 234 39* 21.27 201 116.41 0 0 1 19 4 No. 7 8 8 4 50 29* 12.50 51 98.03 0 0 1 2 1 No. 8 4 4 1 45 24* 15.00 45 100.00 0 0 0 2 0 No. 9 1 1 1 7 7* N/A 3 233.33 0 0 0 1 0 No. 10 4 4 2 12 4* 6.00 10 120.00 0 0 1 0 0 All 184 126 44 2,558 75 31.19 2,151 118.92 0 12 5 249 50
Ellyse Perry: T20I batting by match result Mat Inns NO Runs HS Avg BF SR 100 50 0 4s 6s Won 88 88 34 1,799 75 33.31 1,493 120.49 0 8 3 195 28 Lost 36 36 10 740 70 28.46 636 116.35 0 4 2 54 21 Tied 2 2 0 19 18 9.50 22 86.36 0 0 0 0 1 All 184 126 44 2,558 75 31.19 2,151 118.92 0 12 5 249 50
Ellyse Perry: T20I bowling by match result Mat Inns Balls Mdns Runs Wkts BBI Avg Econ SR 4w 5w Won 97 97 1,668 8 1,485 101 4/12 14.70 5.34 16.51 4 0 Lost 41 41 776 0 903 28 3/14 32.25 6.98 27.71 0 0 Tied 3 3 45 0 39 2 1/9 19.50 5.20 22.50 0 0 No result 1 1 6 0 3 0 0/3 N/A 3.00 N/A 0 0 All 184 142 2,495 8 2,430 131 4/12 18.54 5.84 19.04 4 0
Ellyse Perry: T20I batting by year Mat Inns NO Runs HS Avg BF SR 100 50 0 4s 6s 2008 2 2 1 32 29* 32.00 30 106.66 0 0 0 1 1 2009 1 1 1 4 4* N/A 3 133.33 0 0 0 0 0 2010 4 4 0 27 15 6.75 39 69.23 0 0 0 2 0 2011 3 3 1 8 4* 4.00 7 114.28 0 0 1 0 0 2012 2 2 1 25 24* 25.00 23 108.69 0 0 0 0 0 2013 4 4 2 48 30* 24.00 36 133.33 0 0 1 5 0 2014 13 13 6 187 41* 26.71 174 107.47 0 0 0 17 3 2015 6 6 1 164 55* 32.80 167 98.20 0 1 0 16 0 2016 11 11 3 302 55* 37.75 296 102.02 0 2 1 24 9 2017 3 3 1 28 22* 14.00 29 96.55 0 0 0 2 0 2018 9 9 6 126 47* 42.00 104 121.15 0 0 0 13 3 2019 6 6 5 150 60* 150.00 133 112.78 0 1 0 10 5 2020 8 8 1 117 49 16.71 114 102.63 0 0 1 13 2 2021 4 4 2 35 23* 17.50 33 106.06 0 0 0 3 0 2022 3 3 1 165 75 82.50 103 160.19 0 2 0 18 7 2023 10 10 3 319 70 45.57 211 151.18 0 3 0 30 11 2024 16 16 3 351 37 27.00 294 119.38 0 0 1 34 6 2025 6 6 3 85 32* 28.33 64 132.81 0 0 0 12 0 2026 15 15 3 385 71 32.08 291 132.30 0 3 0 49 3 All 184 126 44 2,558 75 31.19 2,151 118.92 0 12 5 249 50
Ellyse Perry: T20I bowling by year Mat Inns Balls Mdns Runs Wkts BBI Avg Econ SR 4w 5w 2008 2 2 42 0 41 5 4/20 8.20 5.85 8.40 1 0 2009 7 7 126 0 138 4 1/9 34.50 6.57 31.50 0 0 2010 11 11 243 0 193 16 3/14 12.06 4.76 15.18 0 0 2011 7 7 136 0 196 4 1/17 49.00 8.64 34.00 0 0 2012 14 14 300 3 263 14 2/8 18.78 5.26 21.42 0 0 2013 6 6 138 0 159 4 2/21 39.75 6.91 34.50 0 0 2014 13 13 246 1 225 15 3/9 15.00 5.48 16.40 0 0 2015 5 5 114 0 94 5 2/13 18.80 4.94 22.80 0 0 2016 13 13 250 0 204 10 4/12 20.40 4.89 25.00 1 0 2017 3 3 48 0 58 3 2/26 19.33 7.25 16.00 0 0 2018 17 17 306 2 348 20 4/21 17.40 6.82 15.30 1 0 2019 9 9 138 0 134 6 2/11 22.33 5.82 23.00 0 0 2020 9 9 174 0 156 8 4/13 19.50 5.37 21.75 1 0 2021 3 3 24 0 28 1 1/8 28.00 7.00 24.00 0 0 2022 4 4 30 1 35 2 2/10 17.50 7.00 15.00 0 0 2023 9 9 72 1 57 6 2/3 9.50 4.75 12.00 0 0 2024 4 4 48 0 38 3 2/13 12.66 4.75 16.00 0 0 2025 1 1 12 0 18 0 0/18 N/A 9.00 N/A 0 0 2026 5 5 48 0 45 5 2/9 9.00 5.62 9.60 0 0 All 184 142 2,495 8 2,430 131 4/12 18.54 5.84 19.04 4 0
Ellyse Perry: T20I batting by ground Mat Inns NO Runs HS Avg BF SR 100 50 0 4s 6s Manuka Oval 9 9 3 127 49 21.16 134 94.77 0 0 0 11 1 North Sydney Oval 7 7 2 199 70 39.80 139 143.16 0 3 0 23 5 Brabourne Stadium 6 6 2 215 75 53.75 140 153.57 0 2 0 27 7 Melbourne Cricket Ground 5 5 3 68 29* 34.00 59 115.25 0 0 0 3 1 The County Ground 5 5 3 121 47* 60.50 114 106.14 0 0 0 12 1 Adelaide Oval 4 4 0 36 19 9.00 48 75.00 0 0 0 3 0 Junction Oval 4 4 0 45 21 11.25 43 104.65 0 0 0 5 1 Providence Stadium 4 4 3 57 39* 57.00 46 123.91 0 0 0 4 2 Shere Bangla National Stadium 4 4 1 76 31* 25.33 76 100.00 0 0 0 7 1 Sydney Cricket Ground 4 4 2 87 55* 43.50 63 138.09 0 1 0 10 3 Arnos Vale Ground 3 3 0 96 42 32.00 75 128.00 0 0 0 9 2 Dr DY Patil Sports Academy 3 3 1 71 37 35.50 52 136.53 0 0 1 5 4 Kerrydale Oval 3 3 1 36 16 18.00 35 102.85 0 0 0 3 0 Lord's 3 3 1 103 56 51.50 75 137.33 0 1 0 13 1 Sharjah Cricket Stadium 3 3 0 79 32 26.33 62 127.41 0 0 0 8 2 All 184 126 44 2,558 75 31.19 2,151 118.92 0 12 5 249 50
Ellyse Perry: T20I bowling by ground Mat Inns Balls Mdns Runs Wkts BBI Avg Econ SR 4w 5w Manuka Oval 11 11 174 0 167 13 4/13 12.84 5.75 13.38 2 0 North Sydney Oval 10 10 168 1 163 9 2/3 18.11 5.82 18.66 0 0 Melbourne Cricket Ground 9 9 173 0 182 12 4/20 15.16 6.31 14.41 1 0 Brabourne Stadium 7 7 120 0 152 4 2/31 38.00 7.60 30.00 0 0 Bellerive Oval 5 5 90 1 74 4 2/17 18.50 4.93 22.50 0 0 Dr. Y.S. Rajasekhara Reddy ACA-VDCA Cricket Stadium 5 5 108 2 76 5 2/8 15.20 4.22 21.60 0 0 The County Ground 5 5 102 0 98 6 2/11 16.33 5.76 17.00 0 0 Junction Oval 4 4 66 0 84 2 1/19 42.00 7.63 33.00 0 0 Kensington Oval 4 4 72 0 58 4 3/18 14.50 4.83 18.00 0 0 Providence Stadium 4 4 66 0 64 6 3/16 10.66 5.81 11.00 0 0 Shere Bangla National Stadium 4 4 66 0 52 3 2/13 17.33 4.72 22.00 0 0 Sylhet International Cricket Stadium 4 4 78 0 69 6 3/12 11.50 5.30 13.00 0 0 Adelaide Oval 3 3 66 0 64 3 2/10 21.33 5.81 22.00 0 0 County Ground, Taunton 3 3 42 0 50 1 1/13 50.00 7.14 42.00 0 0 Feroz Shah Kotla, Delhi 3 3 54 0 51 1 1/20 51.00 5.66 54.00 0 0 All 184 142 2,495 8 2,430 131 4/12 18.54 5.84 19.04 4 0
Ellyse Perry: T20I batting by series and tournaments Mat Inns NO Runs HS Avg BF SR 100 50 0 4s 6s ICC Women's T20 World Cup 24 24 10 476 71 34.00 363 131.12 0 2 1 49 7 Women's Ashes 12 12 2 207 51* 20.70 186 111.29 0 1 1 18 3 Women's World T20 9 9 3 174 42 29.00 183 95.08 0 0 1 10 6 Australia Women tour of India 6 6 2 236 75 59.00 155 152.25 0 2 1 23 11 Australia Tri-Nation Women's T20 Series 5 5 0 91 49 18.20 94 96.80 0 0 0 11 2 Australia Women tour of New Zealand 5 5 5 89 32* N/A 58 153.44 0 0 0 13 0 Australia Women tour of West Indies 5 5 1 127 42 31.75 110 115.45 0 0 0 12 3 India Women tour of Australia 5 5 0 38 20 7.60 39 97.43 0 0 0 4 0 New Zealand Women tour of Australia 5 5 0 141 52 28.20 113 124.77 0 1 0 21 0 Australia Women in Ireland T20I Series 3 3 1 111 55* 55.50 96 115.62 0 1 0 12 0 Australia Women tour of England 3 3 3 114 60* N/A 94 121.27 0 1 0 7 4 England Women tour of Australia 3 3 1 28 22* 14.00 29 96.55 0 0 0 2 0 All 184 126 44 2,558 75 31.19 2,151 118.92 0 12 5 249 50
Ellyse Perry: T20I bowling by series and tournaments Mat Inns Balls Mdns Runs Wkts BBI Avg Econ SR 4w 5w ICC Women's T20 World Cup 19 19 246 1 233 17 3/16 13.70 5.68 14.47 0 0 Women's Ashes 10 10 198 0 212 6 2/13 35.33 6.42 33.00 0 0 Women's World T20 10 10 201 0 180 9 3/12 20.00 5.37 22.33 0 0 ICC Women's World Twenty20 8 8 192 1 193 11 3/18 17.54 6.03 17.45 0 0 Australia Tri-Nation Women's T20 Series 5 5 102 0 91 7 4/13 13.00 5.35 14.57 1 0 Australia Women tour of West Indies 5 5 66 0 55 2 1/1 27.50 5.00 33.00 0 0 India Tri-Nation Women's T20 Series 5 5 108 0 143 4 2/31 35.75 7.94 27.00 0 0 Australia Women tour of India 4 4 30 1 35 2 2/10 17.50 7.00 15.00 0 0 Australia Women tour of England 3 3 42 0 44 3 2/11 14.66 6.28 14.00 0 0 Australia Women v Pakistan Women T20I Series 3 3 36 0 41 1 1/9 41.00 6.83 36.00 0 0 England Women tour of Australia 3 3 48 0 58 3 2/26 19.33 7.25 16.00 0 0 New Zealand Women tour of Australia 3 3 66 1 75 6 4/21 12.50 6.81 11.00 1 0 All 184 142 2,495 8 2,430 131 4/12 18.54 5.84 19.04 4 0
Ellyse Perry: T20I batting by batting first or chasing Mat Inns NO Runs HS Avg BF SR 100 50 0 4s 6s Batting first 77 77 20 1,611 75 28.26 1,357 118.71 0 7 2 144 34 Chasing 49 49 24 947 60* 37.88 794 119.26 0 5 3 105 16 All 184 126 44 2,558 75 31.19 2,151 118.92 0 12 5 249 50
Ellyse Perry: T20I bowling by bowling first or defending Mat Inns Balls Mdns Runs Wkts BBI Avg Econ SR 4w 5w Bowling first 65 65 1,197 5 1,087 67 4/13 16.22 5.44 17.86 2 0 Defending a total 77 77 1,298 3 1,343 64 4/12 20.98 6.20 20.28 2 0 All 184 142 2,495 8 2,430 131 4/12 18.54 5.84 19.04 4 0
- not recorded in the scorecards · N/A no dismissals or balls to divide by
Best T20I performances Ellyse Perry: highest T20I scores Score BF SR 4s 6s Opponent Ground Date 75 47 159.57 9 3 India Brabourne Stadium 2022-12-14 72* 42 171.42 7 4 India Brabourne Stadium 2022-12-17 71 48 147.91 9 1 Pakistan Headingley 2026-06-23 70 46 152.17 5 4 West Indies North Sydney Oval 2023-10-02 60* 50 120.00 2 3 England County Ground, Bristol 2019-07-31 57* 40 142.50 7 1 Pakistan North Sydney Oval 2023-01-24 56 38 147.36 8 0 India Lord's 2026-06-28 55* 46 119.56 7 0 Ireland YMCA Cricket Club 2015-08-22 55* 41 134.14 4 3 India Sydney Cricket Ground 2016-01-31 55* 47 117.02 3 2 New Zealand Wellington 2016-03-01
Ellyse Perry: best T20I bowling Figures Balls Mdns Econ Opponent Ground Date 4/12 24 0 3.00 India Sydney Cricket Ground 2016-01-31 4/13 24 0 3.25 India Manuka Oval 2020-02-02 4/20 24 0 5.00 England Melbourne Cricket Ground 2008-02-01 4/21 24 0 5.25 New Zealand Manuka Oval 2018-10-05 3/9 24 1 2.25 West Indies Sydney Cricket Ground 2014-11-09 3/12 24 0 3.00 Pakistan Sylhet International Cricket Stadium 2014-03-29 3/14 24 0 3.50 New Zealand Lancaster Park 2010-02-28 3/16 18 0 5.33 India Providence Stadium 2018-11-17 3/18 24 0 4.50 New Zealand Kensington Oval 2010-05-16 2/2 12 1 1.00 West Indies Sir Vivian Richards Stadium 2018-11-22
Latest T20I matches Latest T20I matches Date Opponent Bat Bowl Ground Result 2026-10-22 New Zealand v Australia did not bat - North Sydney Oval No result 2026-10-20 New Zealand 11 - North Sydney Oval Australia won by 40 runs 2026-10-18 New Zealand 52 - North Sydney Oval Australia won by 2 wickets 2026-07-05 England 13* - Lord's Australia won by 7 wickets 2026-06-30 West Indies 2* - Kennington Oval Australia won by 8 wickets 2026-06-28 India 56 0/7 Lord's Australia won by 6 wickets 2026-06-23 Pakistan 71 2/9 Headingley Australia won by 113 runs 2026-06-20 Netherlands 1 - The Rose Bowl Australia won by 98 runs 2026-06-17 Bangladesh 19* 2/14 Headingley Australia won by 9 wickets 2026-06-13 South Africa 36 - Old Trafford Australia won by 65 runs
Questions about Ellyse Perry How many Test runs has Ellyse Perry scored? Ellyse Perry has 1,006 runs in 24 women's Test innings from 15 matches at an average of 59.17 and a strike rate of 46.66. Highest score: 213*. Full answer →
What is Ellyse Perry's Test batting average? Ellyse Perry's Test batting average in women's internationals is 59.17, from 1,006 runs and 24 innings. Full answer →
How many Test wickets has Ellyse Perry taken? Ellyse Perry has taken 39 wickets in women's Test from 15 matches at a bowling average of 21.82. Best innings: 6/32. Full answer →
How many ODI runs has Ellyse Perry scored? Ellyse Perry has 4,691 runs in 143 women's ODI innings from 171 matches at an average of 49.37 and a strike rate of 78.74. Highest score: 112*. Full answer →
What is Ellyse Perry's ODI batting average? Ellyse Perry's ODI batting average in women's internationals is 49.37, from 4,691 runs and 143 innings. Full answer →
How many ODI wickets has Ellyse Perry taken? Ellyse Perry has taken 167 wickets in women's ODI from 171 matches at a bowling average of 25.46. Best innings: 7/22. Full answer →