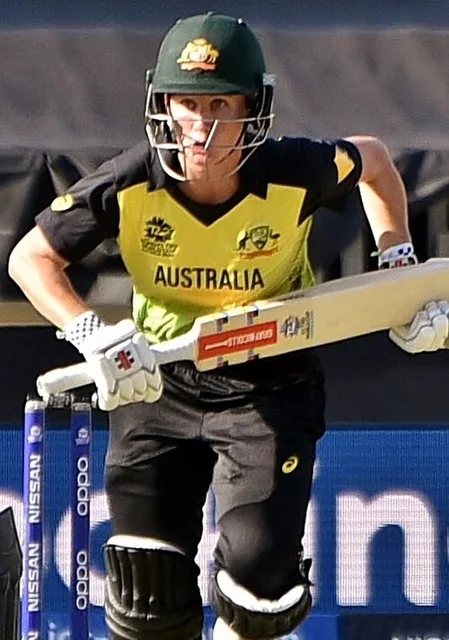
Home / Players / Beth Mooney ⓘ Beth Mooney Australia Women Top-order batter 2016 to 2026
237 Internationals 36th among women
7,747 Runs 14th among women
9 Hundreds 15th among women
128 Catches 7th among women
8 Stumpings 88th among women
Overview Test9 ODI100 T20I128 Recent scores Oldest on the left. Recorded scorecards only. The top edge marks the result for their side.
Last 12 batting innings 414 Runs
41.40 Average
118.28 Strike rate
Career records by format Batting career records by format Format Mat Inns NO Runs HS Avg BF SR 100s 50s 0s 4s 6s Test 9 14 0 578 106 41.28 1,100 52.54 1 4 0 63 0 ODI 100 90 23 3,309 138 49.38 3,718 88.99 6 21 3 342 15 T20I 128 121 28 3,860 117* 41.50 3,044 126.80 2 31 6 500 20
Fielding career records by format Format Mat Inns Ct St Dis Dis/inns Best Test 9 17 16 0 16 0.941 3 (3ct 0st) ODI 100 100 58 3 61 0.610 3 (3ct 0st) T20I 128 127 54 5 59 0.464 3 (3ct 0st)
Runs by format
578 7% 3,309 43% 3,860 50%
Career records checked 2026-11-09. Independent of the scorecard archive.
Australia · Compare with another player
Innings explorer 237 scorecards Open explorer
Scorecard coverage Scorecard coverage of the official career Format Official bat inns In scorecards Official bowl inns In scorecards First Latest Coverage Test 14 14 - 0 2017-11-09 2026-03-06 Complete ODI 90 90 - 0 2016-02-20 2026-10-14 Complete T20I 121 121 - 0 2016-01-26 2026-10-20 Complete
578 Runs 36th among women
41.28 Average
52.54 Strike rate
1 Hundreds 28th among women
4 Fifties
106 Highest
Recent scores Oldest on the left. Recorded scorecards only. The top edge marks the result for their side.
Last 12 batting innings 500 Runs
41.66 Average
55.06 Strike rate
1 Hundreds
Official Test record Official Test batting record Batting Mat Inns NO Runs HS Avg BF SR 100 50 0 4s 6s Career 9 14 0 578 106 41.28 1,100 52.54 1 4 0 63 0
Official Test fielding record Fielding Mat Inns Ct St Dis Dis/Inns Best Career 9 17 16 0 16 0.941 3 (3ct 0st)
Test career in charts Test batting form: average over 10 innings 20 40 60 Overall 41.3 Best spell: 47.1 up to 2026-03-06 Best 47.1 Latest: 47.1 2023 2024 2025 2026 Test runs by year 0 50 100 150 2017: 27 runs 27 2017 2018: 0 runs 2019: 76 runs 76 2019 2020: 0 runs 2021: 15 runs 15 2021 2022: 66 runs 66 2023: 191 runs 191 2023 2024: 78 runs 78 2025: 106 runs 106 2025 2026: 19 runs 19 2026 Last 20 Test innings
0 1-49 50-99 100+ * not out
Test innings by score How Test innings ended Caught 9 · 64.3%
Bowled 3 · 21.4%
LBW 1 · 7.1%
Run out 1 · 7.1%
Test batting position: average and innings Test runs from boundaries Fours 252 · 43.6%
Other runs 326 · 56.4%
Test record by situation complete career Opposition Home and away Match innings Batting position Match result Year Series and tournaments
Beth Mooney: Test batting by opposition Mat Inns NO Runs HS Avg BF SR 100 50 0 4s 6s England 5 8 0 393 106 49.12 763 51.50 1 3 0 38 0 India 3 5 0 107 40 21.40 228 46.92 0 0 0 12 0 South Africa 1 1 0 78 78 78.00 109 71.55 0 1 0 13 0 All 9 14 0 578 106 41.28 1,100 52.54 1 4 0 63 0
Beth Mooney: Test batting by home and away Mat Inns NO Runs HS Avg BF SR 100 50 0 4s 6s Home 6 8 0 311 106 38.87 621 50.08 1 2 0 31 0 Away 3 6 0 267 85 44.50 479 55.74 0 2 0 32 0 All 9 14 0 578 106 41.28 1,100 52.54 1 4 0 63 0
Beth Mooney: Test batting by match innings Mat Inns NO Runs HS Avg BF SR 100 50 0 4s 6s 1st innings of the match 4 4 0 127 51 31.75 244 52.04 0 1 0 11 0 2nd innings of the match 5 5 0 234 106 46.80 453 51.65 1 1 0 24 0 3rd innings of the match 4 4 0 206 85 51.50 375 54.93 0 2 0 27 0 4th innings of the match 1 1 0 11 11 11.00 28 39.28 0 0 0 1 0 All 9 14 0 578 106 41.28 1,100 52.54 1 4 0 63 0
Beth Mooney: Test batting by batting position Mat Inns NO Runs HS Avg BF SR 100 50 0 4s 6s No. 1 2 4 0 191 85 47.75 356 53.65 0 1 0 23 0 No. 2 3 4 0 120 78 30.00 255 47.05 0 1 0 16 0 No. 3 1 2 0 66 63 33.00 140 47.14 0 1 0 6 0 No. 5 2 2 0 131 106 65.50 206 63.59 1 0 0 11 0 No. 6 2 2 0 70 51 35.00 143 48.95 0 1 0 7 0 All 9 14 0 578 106 41.28 1,100 52.54 1 4 0 63 0
Beth Mooney: Test batting by match result Mat Inns NO Runs HS Avg BF SR 100 50 0 4s 6s Won 4 5 0 321 106 64.20 560 57.32 1 2 0 36 0 Lost 1 2 0 73 40 36.50 131 55.72 0 0 0 9 0 Drawn 4 7 0 184 63 26.28 409 44.98 0 2 0 18 0 All 9 14 0 578 106 41.28 1,100 52.54 1 4 0 63 0
Beth Mooney: Test batting by year Mat Inns NO Runs HS Avg BF SR 100 50 0 4s 6s 2017 1 1 0 27 27 27.00 102 26.47 0 0 0 2 0 2019 1 2 0 76 51 38.00 123 61.78 0 1 0 9 0 2021 1 2 0 15 11 7.50 44 34.09 0 0 0 1 0 2022 1 2 0 66 63 33.00 140 47.14 0 1 0 6 0 2023 2 4 0 191 85 47.75 356 53.65 0 1 0 23 0 2024 1 1 0 78 78 78.00 109 71.55 0 1 0 13 0 2025 1 1 0 106 106 106.00 173 61.27 1 0 0 7 0 2026 1 1 0 19 19 19.00 53 35.84 0 0 0 2 0 All 9 14 0 578 106 41.28 1,100 52.54 1 4 0 63 0
Beth Mooney: Test batting by series and tournaments Mat Inns NO Runs HS Avg BF SR 100 50 0 4s 6s Women's Ashes 4 6 0 317 106 52.83 640 49.53 1 2 0 29 0 India Women tour of Australia 2 3 0 34 19 11.33 97 35.05 0 0 0 3 0 All 9 14 0 578 106 41.28 1,100 52.54 1 4 0 63 0
- not recorded in the scorecards · N/A no dismissals or balls to divide by
Best Test performances Beth Mooney: highest Test scores Score BF SR 4s 6s Opponent Ground Date 106 173 61.27 7 0 England Melbourne Cricket Ground 2025-01-30 85 168 50.59 10 0 England Trent Bridge 2023-06-22 78 109 71.55 13 0 South Africa WACA 2024-02-15 63 137 45.98 6 0 England Manuka Oval 2022-01-27 51 90 56.66 5 0 England The County Ground 2019-07-18 40 94 42.55 2 0 India Wankhede Stadium 2023-12-21 33 57 57.89 4 0 England Trent Bridge 2023-06-22 33 37 89.18 7 0 India Wankhede Stadium 2023-12-21 27 102 26.47 2 0 England North Sydney Oval 2017-11-09 25 33 75.75 4 0 England The County Ground 2019-07-18
Latest Test matches Latest Test matches Date Opponent Bat Bowl Ground Result 2026-03-06 India 19 - WACA Australia won by 10 wickets 2025-01-30 England 106 - Melbourne Cricket Ground Australia won by an innings and 122 runs 2024-02-15 South Africa 78 - WACA Australia won by an innings and 284 runs 2023-12-21 India 40 & 33 - Wankhede Stadium India won by 8 wickets 2023-06-22 England 33 & 85 - Trent Bridge Australia won by 89 runs 2022-01-27 England 3 & 63 - Manuka Oval Match drawn 2021-09-30 India 4 & 11 - Metricon Stadium Match drawn 2019-07-18 England 51 & 25 - The County Ground Match drawn 2017-11-09 England 27 - North Sydney Oval Match drawn
3,309 Runs 29th among women
49.38 Average
88.99 Strike rate
6 Hundreds 21st among women
21 Fifties
138 Highest
Recent scores Oldest on the left. Recorded scorecards only. The top edge marks the result for their side.
Last 12 batting innings 523 Runs
47.54 Average
92.89 Strike rate
2 Hundreds
Official ODI record Official ODI batting record Batting Mat Inns NO Runs HS Avg BF SR 100 50 0 4s 6s Career 100 90 23 3,309 138 49.38 3,718 88.99 6 21 3 342 15
Official ODI fielding record Fielding Mat Inns Ct St Dis Dis/Inns Best Career 100 100 58 3 61 0.610 3 (3ct 0st)
ODI career in charts ODI batting form: average over 10 innings 40 80 120 160 Overall 49.4 Best spell: 130.5 up to 2023-07-12 Best 130.5 Latest: 44.7 2017 2019 2021 2023 2025 ODI runs by year 0 200 400 2016: 108 runs 108 2016 2017: 458 runs 458 2018: 155 runs 155 2018 2019: 332 runs 332 2020: 51 runs 51 2020 2021: 243 runs 243 2022: 403 runs 403 2022 2023: 439 runs 439 2024: 274 runs 274 2024 2025: 534 runs 534 2026: 312 runs 312 2026 Last 20 ODI innings
0 1-49 50-99 100+ * not out
ODI innings by score How ODI innings ended Caught 37 · 41.1%
Bowled 15 · 16.7%
LBW 5 · 5.6%
Run out 4 · 4.4%
Stumped 4 · 4.4%
Caught and bowled 2 · 2.2%
Not out 23 · 25.6%
ODI batting position: average and innings ODI runs from boundaries Fours 1,368 · 41.3%
Sixes 90 · 2.7%
Other runs 1,851 · 55.9%
ODI record by situation complete career Opposition Home and away Batting first or chasing Batting position Match result Year Ground Series and tournaments
Beth Mooney: ODI batting by opposition Mat Inns NO Runs HS Avg BF SR 100 50 0 4s 6s India 21 21 5 939 138 58.68 895 104.91 3 5 0 111 4 New Zealand 20 20 2 597 100 33.16 778 76.73 1 3 0 51 2 England 14 14 3 520 81* 47.27 624 83.33 0 4 0 55 2 Pakistan 9 9 4 388 133 77.60 375 103.46 2 1 1 39 4 South Africa 8 8 2 284 82* 47.33 307 92.50 0 3 1 39 0 West Indies 8 8 5 294 70 98.00 388 75.77 0 3 0 21 1 Bangladesh 6 6 2 154 66* 38.50 199 77.38 0 1 0 13 1 Sri Lanka 3 3 0 84 66 28.00 90 93.33 0 1 1 9 0 Ireland 1 1 0 49 49 49.00 62 79.03 0 0 0 4 1 All 100 90 23 3,309 138 49.38 3,718 88.99 6 21 3 342 15
Beth Mooney: ODI batting by home and away Mat Inns NO Runs HS Avg BF SR 100 50 0 4s 6s Home 32 32 9 1,255 133 54.56 1,320 95.07 3 9 1 130 12 Away 36 36 6 1,305 138 43.50 1,568 83.22 2 8 0 131 2 Neutral 22 22 8 749 109 53.50 830 90.24 1 4 2 81 1 All 100 90 23 3,309 138 49.38 3,718 88.99 6 21 3 342 15
Beth Mooney: ODI batting by batting first or chasing Mat Inns NO Runs HS Avg BF SR 100 50 0 4s 6s Batting first 45 45 9 1,939 138 53.86 2,083 93.08 5 12 1 200 9 Chasing 45 45 14 1,370 125* 44.19 1,635 83.79 1 9 2 142 6 All 100 90 23 3,309 138 49.38 3,718 88.99 6 21 3 342 15
Beth Mooney: ODI batting by batting position Mat Inns NO Runs HS Avg BF SR 100 50 0 4s 6s No. 1 11 11 1 565 133 56.50 646 87.46 2 4 0 58 5 No. 2 11 11 1 366 125* 36.60 470 77.87 1 2 2 34 1 No. 3 2 2 0 62 62 31.00 49 126.53 0 1 1 8 0 No. 4 40 40 11 1,474 138 50.82 1,630 90.42 3 10 0 156 5 No. 5 16 16 6 556 73 55.60 647 85.93 0 3 0 52 4 No. 6 10 10 4 286 56 47.66 276 103.62 0 1 0 34 0 All 100 90 23 3,309 138 49.38 3,718 88.99 6 21 3 342 15
Beth Mooney: ODI batting by match result Mat Inns NO Runs HS Avg BF SR 100 50 0 4s 6s Won 79 79 22 2,919 138 51.21 3,185 91.64 5 18 2 307 15 Lost 10 10 1 376 100 41.77 509 73.87 1 3 1 35 0 Tied 1 1 0 14 14 14.00 24 58.33 0 0 0 0 0 All 100 90 23 3,309 138 49.38 3,718 88.99 6 21 3 342 15
Beth Mooney: ODI batting by year Mat Inns NO Runs HS Avg BF SR 100 50 0 4s 6s 2016 5 5 0 108 53 21.60 191 56.54 0 1 0 10 0 2017 11 11 0 458 100 41.63 588 77.89 1 4 2 48 1 2018 5 5 3 155 56 77.50 128 121.09 0 1 0 21 0 2019 10 10 3 332 66 47.42 409 81.17 0 2 0 31 1 2020 3 3 1 51 29* 25.50 52 98.07 0 0 0 4 1 2021 5 5 1 243 125* 60.75 264 92.04 1 1 0 23 0 2022 10 10 6 403 73 100.75 418 96.41 0 3 0 41 1 2023 11 11 4 439 133 62.71 487 90.14 1 2 0 41 5 2024 12 12 3 274 82* 30.44 326 84.04 0 3 1 34 0 2025 12 12 1 534 138 48.54 528 101.13 2 2 0 64 2 2026 6 6 1 312 106* 62.40 327 95.41 1 2 0 25 4 All 100 90 23 3,309 138 49.38 3,718 88.99 6 21 3 342 15
Beth Mooney: ODI batting by ground Mat Inns NO Runs HS Avg BF SR 100 50 0 4s 6s Allan Border Field 13 13 3 366 76 36.60 360 101.66 0 4 0 34 4 Bay Oval 9 9 1 289 69 36.12 363 79.61 0 3 0 27 0 Basin Reserve 7 7 3 204 66* 51.00 244 83.60 0 1 0 17 0 County Ground, Bristol 5 5 1 189 81* 47.25 277 68.23 0 1 1 20 0 North Sydney Oval 4 4 1 243 133 81.00 226 107.52 1 1 1 28 5 The County Ground 4 4 0 140 70 35.00 175 80.00 0 2 0 16 1 Bellerive Oval 3 3 1 187 106* 93.50 182 102.74 1 1 0 19 1 Grace Road 3 3 1 68 43* 34.00 82 82.92 0 0 1 7 0 Holkar Cricket Stadium 3 3 0 74 42 24.66 92 80.43 0 0 0 8 0 Junction Oval 3 3 2 58 35* 58.00 77 75.32 0 0 0 6 1 Kinrara Academy Oval 3 3 2 65 38 65.00 69 94.20 0 0 0 7 0 Shere Bangla National Stadium 3 3 1 54 25 27.00 98 55.10 0 0 0 5 0 Wankhede Stadium 3 3 0 55 42 18.33 74 74.32 0 0 0 5 0 All 100 90 23 3,309 138 49.38 3,718 88.99 6 21 3 342 15
Beth Mooney: ODI batting by series and tournaments Mat Inns NO Runs HS Avg BF SR 100 50 0 4s 6s ICC Women's World Cup 23 23 6 773 109 45.47 891 86.75 1 4 2 84 1 ICC Women's Championship 8 8 2 263 66 43.83 285 92.28 0 3 0 32 0 India Women tour of Australia 8 8 2 457 125* 76.16 456 100.21 2 3 0 47 3 Women's Ashes 7 7 1 293 81* 48.83 368 79.61 0 3 0 29 2 Australia Women tour of India 6 6 1 288 138 57.60 257 112.06 1 1 0 38 1 Rose Bowl 6 6 1 316 100 63.20 384 82.29 1 2 0 27 1 Australia Women tour of New Zealand 5 5 0 82 28 16.40 96 85.41 0 0 0 6 0 Australia Women tour of Bangladesh 3 3 1 54 25 27.00 98 55.10 0 0 0 5 0 Australia Women tour of England 3 3 1 87 43* 43.50 104 83.65 0 0 0 9 0 New Zealand Women tour of Australia 3 3 1 51 29* 25.50 52 98.07 0 0 0 4 1 Pakistan Women tour of Australia 3 3 1 191 133 95.50 164 116.46 1 1 0 19 4 South Africa Women tour of Australia 3 3 2 134 82* 134.00 127 105.51 0 2 1 19 0 All 100 90 23 3,309 138 49.38 3,718 88.99 6 21 3 342 15
- not recorded in the scorecards · N/A no dismissals or balls to divide by
Best ODI performances Beth Mooney: highest ODI scores Score BF SR 4s 6s Opponent Ground Date 138 75 184.00 23 1 India Arun Jaitley Stadium 2025-09-20 133 105 126.66 14 4 Pakistan North Sydney Oval 2023-01-21 125* 133 93.98 12 0 India Great Barrier Reef Arena 2021-09-24 109 114 95.61 11 0 Pakistan R Premadasa Stadium 2025-10-08 106* 84 126.19 10 1 India Bellerive Oval 2026-03-01 100 123 81.30 6 0 New Zealand Eden Park Outer Oval 2017-02-26 82* 91 90.10 10 0 South Africa North Sydney Oval 2024-02-10 81* 99 81.81 6 0 England County Ground, Bristol 2023-07-12 77* 74 104.05 9 0 India Maharaja Yadavindra Singh International Cricket Stadium 2025-09-14 76 79 96.20 5 2 India Allan Border Field 2026-02-24
Latest ODI matches Latest ODI matches Date Opponent Bat Bowl Ground Result 2026-10-14 Bangladesh 21 - Allan Border Field Australia won by 8 wickets 2026-10-11 Bangladesh v Australia did not bat - Allan Border Field Australia won by 9 wickets 2026-10-09 Bangladesh 13 - Allan Border Field Australia won by 7 wickets 2026-04-02 West Indies v Australia did not bat - Warner Park Australia won by 9 wickets 2026-03-29 West Indies 65 - Warner Park Australia won by 90 runs 2026-03-01 India 106* - Bellerive Oval Australia won by 185 runs 2026-02-27 India 31 - Bellerive Oval Australia won by 5 wickets 2026-02-24 India 76 - Allan Border Field Australia won by 6 wickets 2025-10-30 India 24 - Dr DY Patil Sports Academy India won by 5 wickets 2025-10-25 South Africa 42 - Holkar Cricket Stadium Australia won by 7 wickets
3,860 Runs 5th among women
41.50 Average
126.80 Strike rate
2 Hundreds 8th among women
54 Catches 9th among women
5 Stumpings 81st among women
Recent scores Oldest on the left. Recorded scorecards only. The top edge marks the result for their side.
Last 12 batting innings 422 Runs
42.20 Average
139.27 Strike rate
Official T20I record Official T20I batting record Batting Mat Inns NO Runs HS Avg BF SR 100 50 0 4s 6s Career 128 121 28 3,860 117* 41.50 3,044 126.80 2 31 6 500 20
Official T20I fielding record Fielding Mat Inns Ct St Dis Dis/Inns Best Career 128 127 54 5 59 0.464 3 (3ct 0st)
T20I career in charts T20I batting form: average over 20 innings 20 40 60 Overall 41.5 Best spell: 58.2 up to 2025-03-23 Best 58.2 Latest: 48.9 2018 2020 2022 2024 2026 T20I runs by year 0 200 400 2016: 133 runs 133 2016 2017: 226 runs 226 2018: 370 runs 370 2018 2019: 256 runs 256 2020: 504 runs 504 2020 2021: 160 runs 160 2022: 449 runs 449 2022 2023: 410 runs 410 2024: 494 runs 494 2024 2025: 379 runs 379 2026: 479 runs 479 2026 Last 20 T20I innings
0 1-49 50-99 100+ * not out
T20I innings by score How T20I innings ended Caught 55 · 45.5%
Bowled 18 · 14.9%
LBW 4 · 3.3%
Run out 7 · 5.8%
Stumped 9 · 7.4%
Not out 28 · 23.1%
T20I batting position: average and innings T20I runs from boundaries Fours 2,000 · 51.8%
Sixes 120 · 3.1%
Other runs 1,740 · 45.1%
T20I record by situation complete career Opposition Home and away Batting first or chasing Batting position Match result Year Ground Series and tournaments
Beth Mooney: T20I batting by opposition Mat Inns NO Runs HS Avg BF SR 100 50 0 4s 6s India 29 29 5 987 89* 41.12 810 121.85 0 9 0 126 2 New Zealand 27 27 4 600 75* 26.08 484 123.96 0 4 3 78 3 England 19 19 5 811 117* 57.92 598 135.61 1 8 1 111 5 West Indies 11 11 2 253 79 28.11 204 124.01 0 2 0 31 2 Pakistan 9 9 2 278 70* 39.71 217 128.11 0 1 1 35 3 South Africa 8 8 2 340 82 56.66 277 122.74 0 3 0 43 3 Sri Lanka 7 7 4 289 113 96.33 226 127.87 1 1 0 39 0 Bangladesh 6 6 2 158 81* 39.50 123 128.45 0 2 1 21 0 Ireland 3 3 1 68 45* 34.00 57 119.29 0 0 0 7 1 Barbados 1 1 0 2 2 2.00 6 33.33 0 0 0 0 0 Netherlands 1 1 1 74 74* N/A 42 176.19 0 1 0 9 1 All 128 121 28 3,860 117* 41.50 3,044 126.80 2 31 6 500 20
Beth Mooney: T20I batting by home and away Mat Inns NO Runs HS Avg BF SR 100 50 0 4s 6s Home 48 48 9 1,723 117* 44.17 1,327 129.84 2 12 1 232 9 Away 39 39 11 1,284 89* 45.85 1,013 126.75 0 13 2 168 7 Neutral 33 33 8 849 74* 33.96 699 121.45 0 6 3 99 4 Unknown 1 1 0 4 4 4.00 5 80.00 0 0 0 1 0 All 128 121 28 3,860 117* 41.50 3,044 126.80 2 31 6 500 20
Beth Mooney: T20I batting by batting first or chasing Mat Inns NO Runs HS Avg BF SR 100 50 0 4s 6s Batting first 65 65 12 2,285 117* 43.11 1,743 131.09 2 19 4 288 12 Chasing 56 56 16 1,575 89* 39.37 1,301 121.06 0 12 2 212 8 All 128 121 28 3,860 117* 41.50 3,044 126.80 2 31 6 500 20
Beth Mooney: T20I batting by batting position Mat Inns NO Runs HS Avg BF SR 100 50 0 4s 6s No. 1 39 39 10 1,373 117* 47.34 1,015 135.27 1 9 2 186 7 No. 2 79 79 16 2,471 113 39.22 2,016 122.56 1 22 3 312 13 No. 7 1 1 1 1 1* N/A 1 100.00 0 0 0 0 0 No. 8 1 1 1 15 15* N/A 11 136.36 0 0 0 2 0 No. 9 1 1 0 0 0 0.00 1 0.00 0 0 1 0 0 All 128 121 28 3,860 117* 41.50 3,044 126.80 2 31 6 500 20
Beth Mooney: T20I batting by match result Mat Inns NO Runs HS Avg BF SR 100 50 0 4s 6s Won 94 94 23 3,203 113 45.11 2,477 129.30 1 28 6 418 17 Lost 23 23 3 495 117* 24.75 451 109.75 1 1 0 59 2 Tied 2 2 1 147 82* 147.00 99 148.48 0 2 0 22 1 No result 2 2 1 15 11* 15.00 17 88.23 0 0 0 1 0 All 128 121 28 3,860 117* 41.50 3,044 126.80 2 31 6 500 20
Beth Mooney: T20I batting by year Mat Inns NO Runs HS Avg BF SR 100 50 0 4s 6s 2016 7 7 3 133 36 33.25 134 99.25 0 0 0 11 0 2017 6 6 2 226 117* 56.50 160 141.25 1 1 0 33 3 2018 16 16 1 370 71 24.66 312 118.58 0 1 2 49 1 2019 9 9 2 256 113 36.57 194 131.95 1 1 0 37 1 2020 14 14 3 504 81* 45.81 410 122.92 0 6 0 64 3 2021 5 5 1 160 61* 40.00 138 115.94 0 2 1 20 0 2022 13 13 5 449 89* 56.12 334 134.43 0 4 0 61 2 2023 13 13 3 410 74* 41.00 340 120.58 0 4 1 55 3 2024 17 17 4 494 82 38.00 423 116.78 0 4 1 58 3 2025 6 6 2 379 94* 94.75 244 155.32 0 4 0 52 1 2026 15 15 2 479 79 36.84 355 134.92 0 4 1 60 3 All 128 121 28 3,860 117* 41.50 3,044 126.80 2 31 6 500 20
Beth Mooney: T20I batting by ground Mat Inns NO Runs HS Avg BF SR 100 50 0 4s 6s Manuka Oval 10 10 4 490 117* 81.66 369 132.79 1 3 0 68 3 North Sydney Oval 9 9 2 364 113 52.00 246 147.96 1 1 0 55 2 Brabourne Stadium 7 7 0 154 71 22.00 122 126.22 0 1 1 20 0 Allan Border Field 6 6 0 46 24 7.66 49 93.87 0 0 1 7 0 Edgbaston 6 6 2 240 70* 60.00 181 132.59 0 3 0 31 1 Dr DY Patil Sports Academy 5 5 3 260 89* 130.00 203 128.07 0 3 0 37 1 Adelaide Oval 4 4 1 137 94* 45.66 106 129.24 0 1 0 13 0 Junction Oval 4 4 1 197 71* 65.66 161 122.36 0 3 0 24 2 Providence Stadium 4 4 0 107 48 26.75 95 112.63 0 0 0 15 0 Sydney Cricket Ground 4 4 0 142 75 35.50 117 121.36 0 1 0 18 0 Arnos Vale Ground 3 3 0 107 79 35.66 83 128.91 0 1 0 11 2 Bready Cricket Club 3 3 2 65 45* 65.00 55 118.18 0 0 0 6 1 Kensington Oval 3 3 1 36 24* 18.00 40 90.00 0 0 0 4 0 Kinrara Academy Oval 3 3 0 88 38 29.33 71 123.94 0 0 0 11 1 Lord's 3 3 0 118 64 39.33 96 122.91 0 1 0 17 0 All 128 121 28 3,860 117* 41.50 3,044 126.80 2 31 6 500 20
Beth Mooney: T20I batting by series and tournaments Mat Inns NO Runs HS Avg BF SR 100 50 0 4s 6s ICC Women's T20 World Cup 30 30 7 974 81* 42.34 801 121.59 0 9 2 116 5 New Zealand Women tour of Australia 11 11 1 178 39 17.80 145 122.75 0 0 1 28 0 Australia Women tour of India 8 8 3 294 89* 58.80 237 124.05 0 3 0 41 1 Australia Women tour of New Zealand 6 6 2 231 75* 57.75 158 146.20 0 3 1 30 1 Australia Women tour of West Indies 6 6 1 143 79 28.60 123 116.26 0 1 0 15 2 Women's Ashes 6 6 2 328 94* 82.00 244 134.42 0 3 0 44 0 Australia Tri-Nation Women's T20 Series 5 5 1 208 71* 52.00 169 123.07 0 3 0 28 1 Commonwealth Games Women's Cricket Competition 5 5 1 179 70* 44.75 134 133.58 0 2 0 22 1 India Women tour of Australia 5 5 0 152 61 30.40 131 116.03 0 1 0 19 0 India Tri-Nation Women's T20 Series 4 4 0 120 71 30.00 88 136.36 0 1 1 16 0 Australia Women tour of Bangladesh 3 3 1 65 55* 32.50 50 130.00 0 1 1 10 0 Australia Women tour of England 3 3 0 65 54 21.66 52 125.00 0 1 0 9 1 All 128 121 28 3,860 117* 41.50 3,044 126.80 2 31 6 500 20
- not recorded in the scorecards · N/A no dismissals or balls to divide by
Best T20I performances Beth Mooney: highest T20I scores Score BF SR 4s 6s Opponent Ground Date 117* 70 167.14 19 1 England Manuka Oval 2017-11-21 113 61 185.24 20 0 Sri Lanka North Sydney Oval 2019-09-29 94* 63 149.20 10 0 England Adelaide Oval 2025-01-25 89* 57 156.14 16 0 India Dr DY Patil Sports Academy 2022-12-09 86* 56 153.57 11 2 England North Sydney Oval 2017-11-17 82* 54 151.85 13 0 India Dr DY Patil Sports Academy 2022-12-11 82 55 149.09 11 1 South Africa Bellerive Oval 2024-01-30 81* 58 139.65 9 0 Bangladesh Manuka Oval 2020-02-27 79 55 143.63 7 2 West Indies Arnos Vale Ground 2026-03-19 78* 54 144.44 10 0 India Melbourne Cricket Ground 2020-03-08
Latest T20I matches Latest T20I matches Date Opponent Bat Bowl Ground Result 2026-10-22 New Zealand v Australia did not bat - North Sydney Oval No result 2026-10-20 New Zealand 39 - North Sydney Oval Australia won by 40 runs 2026-10-18 New Zealand 38 - North Sydney Oval Australia won by 2 wickets 2026-07-05 England 64 - Lord's Australia won by 7 wickets 2026-06-30 West Indies 61* - Kennington Oval Australia won by 8 wickets 2026-06-28 India 22 - Lord's Australia won by 6 wickets 2026-06-23 Pakistan 0 - Headingley Australia won by 113 runs 2026-06-20 Netherlands 74* - The Rose Bowl Australia won by 98 runs 2026-06-17 Bangladesh 10 - Headingley Australia won by 9 wickets 2026-06-13 South Africa 7 - Old Trafford Australia won by 65 runs
Questions about Beth Mooney How many Test runs has Beth Mooney scored? Beth Mooney has 578 runs in 14 women's Test innings from 9 matches at an average of 41.28 and a strike rate of 52.54. Highest score: 106. Full answer →
What is Beth Mooney's Test batting average? Beth Mooney's Test batting average in women's internationals is 41.28, from 578 runs and 14 innings. Full answer →
How many ODI runs has Beth Mooney scored? Beth Mooney has 3,309 runs in 90 women's ODI innings from 100 matches at an average of 49.38 and a strike rate of 88.99. Highest score: 138. Full answer →
What is Beth Mooney's ODI batting average? Beth Mooney's ODI batting average in women's internationals is 49.38, from 3,309 runs and 90 innings. Full answer →
How many T20I runs has Beth Mooney scored? Beth Mooney has 3,860 runs in 121 women's T20I innings from 128 matches at an average of 41.50 and a strike rate of 126.80. Highest score: 117*. Full answer →
What is Beth Mooney's T20I batting average? Beth Mooney's T20I batting average in women's internationals is 41.50, from 3,860 runs and 121 innings. Full answer →