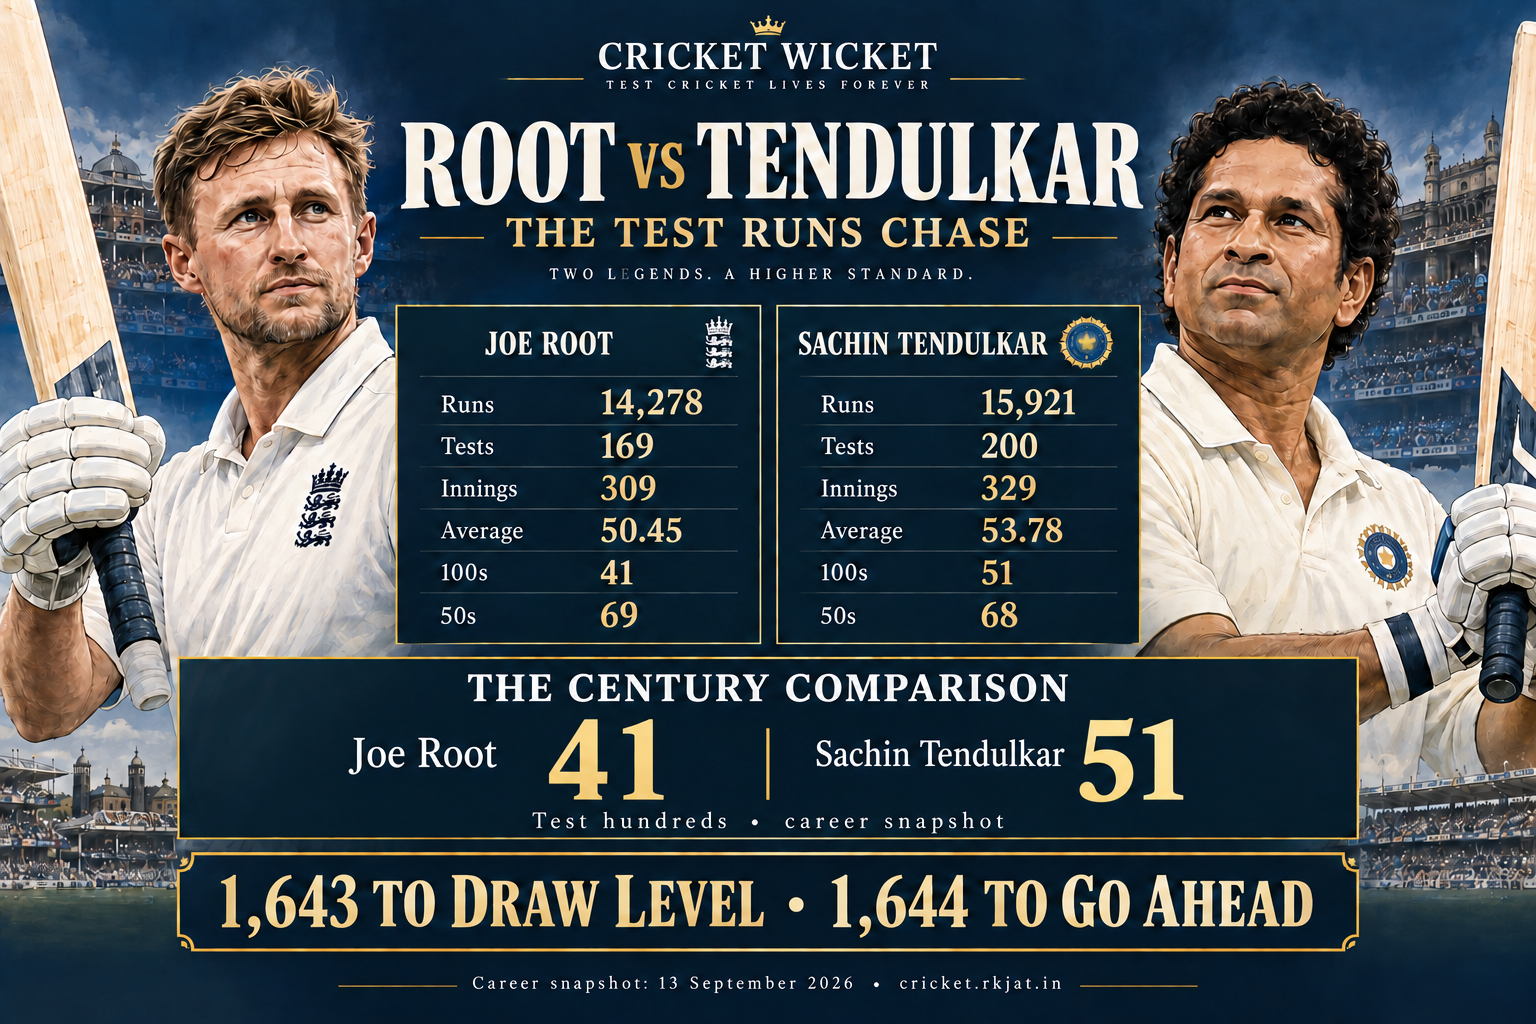
Joe Root’s pursuit of Sachin Tendulkar is easy to follow in runs. Understanding the comparison takes a little more care. After the Edgbaston Test against Pakistan, our 13 September snapshot puts Root on 14,278 Test runs, against Tendulkar’s 15,921. The gap is 1,643; Root needs 1,644 more runs to move ahead.
What changed at Edgbaston?
Root added 8 in England’s first innings and an unbeaten 62 in the chase: 70 runs across the Test. His total moved from 14,208 to 14,278. The second innings also added a fifty and a not-out. Read the England–Pakistan third Test scorecard.
Runs need an opportunity count
Tendulkar’s 15,921 runs came from 329 innings in 200 Tests. Root’s 14,278 came from 309 innings in 169 Tests. That leaves a difference of 31 matches but only 20 batting innings. Tests do not guarantee two innings for every batter, so the match gap alone is a poor measure of batting opportunity. These are each player’s career totals at the snapshot, not a comparison at the same career stage.
Average: Tendulkar retains the advantage
Tendulkar’s batting average is 53.78, against Root’s 50.45. Average divides runs by dismissals: Tendulkar has 296 dismissals and Root 283. Root’s unbeaten 62 at Edgbaston increased his runs without increasing his dismissals. Average is a useful companion to volume, but neither number adjusts for opposition, pitches, batting position or era.
Centuries and fifties tell different parts of the story
Tendulkar leads the century count 51 to 41. Root has 69 scores from 50 to 99, one more than Tendulkar’s 68. Adding hundreds and fifties gives 119 scores of at least 50 for Tendulkar and 110 for Root. Those counts reward sustained output; they cannot by themselves establish who played the more valuable innings in its match situation.
How many runs does Root need to break the record?
Exactly 1,644 from this snapshot. Another 1,643 would put him level on 15,921. A forecast of when he might pass the record would need assumptions about future appearances, innings and form. The gap is arithmetic; a completion date would be a prediction.
Read another comparison
For a different way of comparing scoring styles, explore Rohit Sharma vs Virat Kohli: the ODI boundary story. Their fours, sixes and boundary-run shares show why a single leaderboard rarely tells the whole story.
The figures behind the infographic
| Statistic | Joe Root | Sachin Tendulkar |
|---|---|---|
| Tests | 169 | 200 |
| Batting innings | 309 | 329 |
| Runs | 14278 | 15921 |
| Dismissals | 283 | 296 |
| Not-outs | 26 | 33 |
| Batting average | 50.45 | 53.78 |
| 100s | 41 | 51 |
| 50s (50–99) | 69 | 68 |
| Highest score | 262 | 248* |
Compare two international careers · Joe Root profile · Sachin Tendulkar profile · Create your own visual
Figures frozen from Crickrida’s official career snapshot checked 13 September 2026, including the Edgbaston Test. Batting average is runs divided by dismissals, displayed to two decimal places using the source’s truncation convention. Fifties count scores from 50 to 99; centuries are separate. An asterisk denotes not out. Caricatures are original illustrations. Career totals are independent of ball-by-ball archive coverage.